 What is the Graph of
$\,y = f(x)\,$?
The lesson Graphs of Functions in the Algebra II curriculum gives a thorough introduction to graphs of functions.
For those who need only a quick review, the key concepts are repeated here. The exercises in this lesson duplicate (and then extend) those in Graphs of Functions.
-
The equation ‘$\,y = f(x)\,$’ is an equation in two variables, $\,x\,$ and $\,y\,.$
The graph of the equation $\,y = f(x)\,$ is the picture of all the points $\,(x,y)\,$ that make it true. Observe that to make this equation true, $\,y\,$ must equal $\,f(x)\,.$
Thus, the graph of the equation $\,y = f(x)\,$ is the set of all points of the form $\,\color{green}{\bigl(x,\overbrace{f(x)}^{y}\bigr)}\,.$
-
The graph of a function $\,f\,$ is the set of all its $\,\bigl(\text{input},\text{output}\bigr)\,$ pairs. Recall that when $\,x\,$ is an input, then $\,f(x)\,$ is the corresponding output.
Thus, the graph of $\,f\,$ is the set of all points of the form $\,\color{green}{\bigl(x,f(x)\bigr)}\,.$
-
Compare!
The following two requests ask for exactly the same thing:
Graph the equation $\,\color{green}{y = f(x)}\,.$
Graph the function $\,\color{green}{f}\,.$Both are asking for the set of all points of the form $\,\bigl(x,f(x)\bigr)\,.$
Understanding the Relationship Between an Equation and its Graph
There are things that you can DO to an equation $\,y = f(x)\,$ that will change its graph.
Or, there are things that you can DO to a graph that will change its equation.
Stretching, shrinking, moving up/down left/right, reflecting about axes—they're all covered thoroughly in the next few web exercises:
- Shifting graphs up/down/left/right
- Reflecting about axes, and the absolute value transformation
- Horizontal and vertical stretching/shrinking
An understanding of these graphical transformations makes it easy to graph a wide variety of functions, by starting with a basic model and then applying a sequence of transformations to change it to the desired function.
For example, after mastering the graphical transformations, you'll be able to do the following:
-
Need the graph of $\,y = -\sqrt{3x} + 2\,$? No problem!
Start with the graph of $\,y = \sqrt{x}\,$ (one of the basic models):
(A) Divide all the $x$-values by $\,3\,$ (a horizontal compression/shrink—the points get closer to the $y$-axis).
(B) Then reflect about the $x$-axis.
(C) Then move it up $\,2\,.$
You'll understand why the order BAC would also work, but the order CAB doesn't!
-
Or, suppose you have the graph (call it $\,G\,$) of a known equation $\,y = f(x)\,.$ The graph is being changed, though, and you need the corresponding new equations.
If $\,G\,$ is shifted up $\,2\,$ units, the new equation is $\,y = f(x) + 2\,.$ (Transformations involving $\,y\,$ are intuitive.)
If $\,G\,$ is shifted right $\,2\,$ units, the new equation is $\,y = f(x-2)\,.$ (Transformations involving $\,x\,$ are counter-intuitive.)
If $\,G\,$ is reflected about the $y$-axis, the new equation is $\,y = f(-x)\,.$
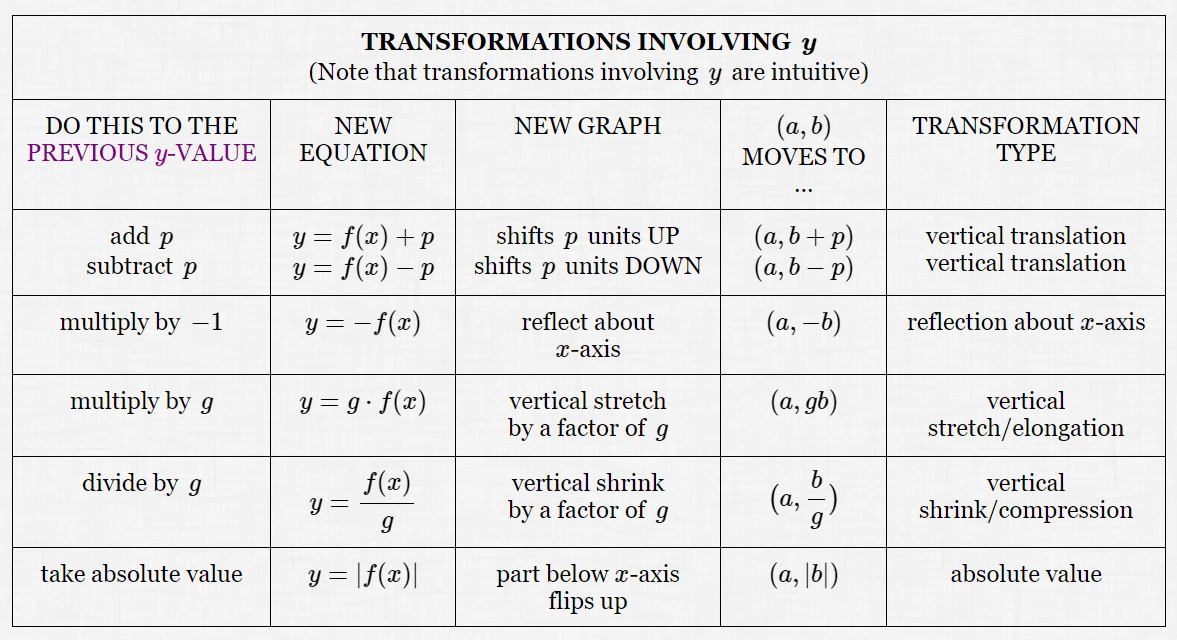
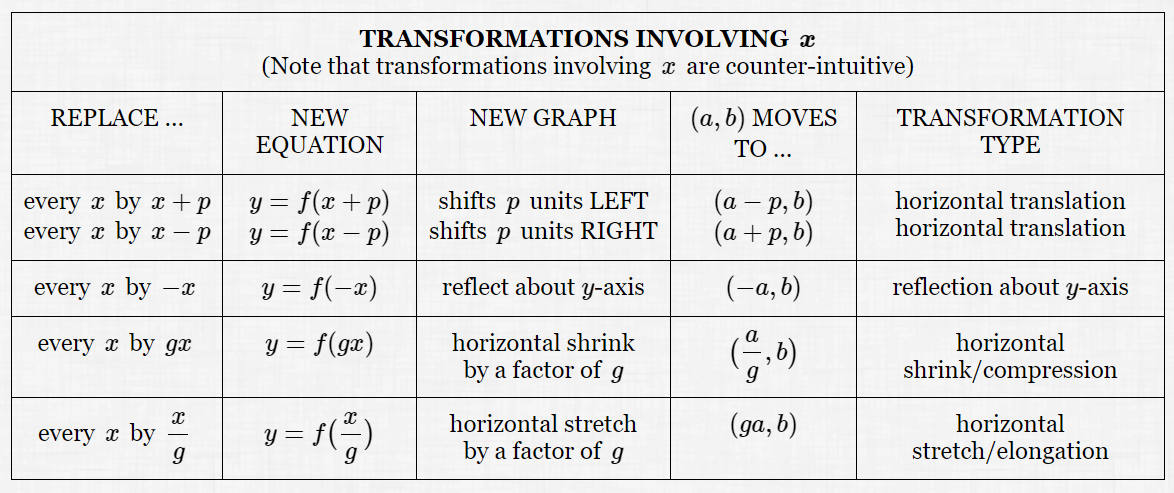
For your convenience, all the graphical transformations are summarized in the Graphical Transformations tables below. Given any entry in a row, you should (eventually!) be able to fill in all the remaining entries in that row.
(Cases 18–24 below help you master the ideas in the Graphical Transformation tables!)
Summary: Graphical Transformations
Set-Up for the Tables:
-
You're starting with the equation $\,y = f(x)\,.$ So, the ‘previous $\color{purple}{y}$-value’ (see the first column below) is $\,f(x)\,.$
(For a mobile-friendly design, the columns turned into rows. Images of the original table formatting are given below.)
-
Assume:
$p \gt 0$ (‘$p$’ for Positive)
$g \gt 1$ (‘$g$’ for Greater than) - The point $\,(a,b)\,$ is a point on the graph of $\,y = f(x)\,,$ so that the equation $\,b = f(a)\,$ is true.
Image of original table formatting:

|
TRANSFORMATIONS INVOLVING $\,\boldsymbol{y}$ (Note that transformations involving $\,y\,$ are intuitive) |
|
| Do This to the Previous $y$-value: |
add $\,p$ subtract $\,p$ |
| New Equation: |
$y = f(x) + p$ $y = f(x) - p$ |
| New Graph: | shifts $\,p\,$ units UP shifts $\,p\,$ units DOWN |
| $(a,b)$ Moves to ... |
$(a,b+p)$ $(a,b-p)$ |
| Transformation Type: |
vertical translation vertical translation |
|
TRANSFORMATIONS INVOLVING $\,\boldsymbol{y}$ (intuitive) |
|
| Do This to the Previous $y$-value: | multiply by $\,-1$ |
| New Equation: | $y = -f(x)$ |
| New Graph: | reflect about $x$-axis |
| $(a,b)$ Moves to ... | $(a,-b)$ |
| Transformation Type: | reflection about $x$-axis |
|
TRANSFORMATIONS INVOLVING $\,\boldsymbol{y}$ (intuitive) |
|
| Do This to the Previous $y$-value: | multiply by $\,g$ |
| New Equation: | $y = g\cdot f(x)$ |
| New Graph: | vertical stretch by a factor of $\,g$ |
| $(a,b)$ Moves to ... | $(a,gb)$ |
| Transformation Type: | vertical stretch/elongation |
|
TRANSFORMATIONS INVOLVING $\,\boldsymbol{y}$ (intuitive) |
|
| Do This to the Previous $y$-value: | divide by $\,g$ |
| New Equation: | $\displaystyle y = \frac{f(x)}{g}$ |
| New Graph: | vertical shrink by a factor of $\,g$ |
| $(a,b)$ Moves to ... | $\displaystyle \bigl(a,\frac{b}{g}\bigr)$ |
| Transformation Type: | vertical shrink/compression |
|
TRANSFORMATIONS INVOLVING $\,\boldsymbol{y}$ (intuitive) |
|
| Do This to the Previous $y$-value: | take absolute value |
| New Equation: | $y = |f(x)|$ |
| New Graph: | part below $x$-axis flips up |
| $(a,b)$ Moves to ... | $(a,|b|)$ |
| Transformation Type: | absolute value |
Image of original table formatting:

|
TRANSFORMATIONS INVOLVING $\,\boldsymbol{x}$ (Note that transformations involving $\,x\,$ are counter-intuitive) |
|
| Replace ... |
every $\,x\,$ by $\,x+p$ every $\,x\,$ by $\,x-p$ |
| New Equation: |
$y = f(x+p)$ $y = f(x-p)$ |
| New Graph: |
shifts $\,p\,$ units LEFT
shifts $\,p\,$ units RIGHT |
| $(a,b)$ Moves to ... |
$(a-p,b)$ $(a+p,b)$ |
| Transformation Type: |
horizontal translation horizontal translation |
|
TRANSFORMATIONS INVOLVING $\,\boldsymbol{x}$ (counter-intuitive) |
|
| Replace ... | every $\,x\,$ by $\,-x\,$ |
| New Equation: | $y = f(-x)$ |
| New Graph: | reflect about $y$-axis |
| $(a,b)$ Moves to ... | $(-a,b)$ |
| Transformation Type: | reflection about $y$-axis |
|
TRANSFORMATIONS INVOLVING $\,\boldsymbol{x}$ (counter-intuitive) |
|
| Replace ... | every $\,x\,$ by $\,gx\,$ |
| New Equation: | $y = f(gx)$ |
| New Graph: | horizontal shrink by a factor of $\,g$ |
| $(a,b)$ Moves to ... | $\displaystyle \bigl(\frac{a}{g},b\bigr)$ |
| Transformation Type: | horizontal shrink/compression |
|
TRANSFORMATIONS INVOLVING $\,\boldsymbol{x}$ (counter-intuitive) |
|
| Replace ... | every $\,x\,$ by $\,\displaystyle \frac{x}{g}\,$ |
| New Equation: | $\displaystyle y = f\bigl(\frac{x}{g}\bigr)$ |
| New Graph: | horizontal stretch by a factor of $\,g$ |
| $(a,b)$ Moves to ... | $(ga,b)$ |
| Transformation Type: | horizontal stretch/elongation |