 Graphs of Functions
To prepare for this section, you may find it helpful to review the following concepts in the Algebra I curriculum:
- Introduction to Functions
- Introduction to Function Notation
-
Locating Points in Quadrants and on Axes
- Domain and Range of a Function
Recall that a function is a rule that takes an input, does something to it, and gives an output. Each input has exactly one output.
If the function name is $\,f\,,$ and the input name is $\,x\,,$ then the unique corresponding output is called $\,f(x)\,$ (which is read aloud as ‘$\,f\,$ of $\,x\,$’). See function notation for details.
When you're working with a function, it's critical that you understand the relationship between its inputs and their corresponding outputs. That is, it's critical that you understand the function's (input,output) pairs. Of course, there are usually infinitely many of these (input,output) pairs—the graph of the function!
For example, consider the squaring function—the function that takes a real number input, and squares it.
When the input is $\,3\,,$ the output is $\,3^2 = 9\,.$ Thus, $\,(3,9)\,$ is an (input,output) pair.
When the input is $\,4\,,$ the output is $\,4^2 = 16\,.$ Thus, $\,(4,16)\,$ is an (input,output) pair.
When the input is $\,-3\,,$ the output is $\,(-3)^2 = 9\,.$ Thus, $\,(-3,9)\,$ is an (input,output) pair.
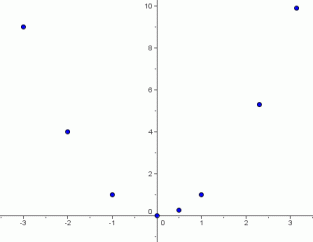
Here's a table (below) that summarizes a few of the infinitely-many (input,output) pairs. Of course, it's impossible to list them all.
When these points are plotted in an $\,xy\,$-coordinate system (see below), with the inputs along the $\,x\,$-axis and the outputs along the $\,y\,$-axis, a shape clearly emerges in the coordinate plane.
Some (Input,Output) Pairs for the Squaring Function
| input | output | (input,output) |
| $-3$ | $9$ | $(-3,9)$ |
| $-2$ | $4$ | $(-2,4)$ |
| $-1$ | $1$ | $(-1,1)$ |
| $0$ | $0$ | $(0,0)$ |
| $\frac12$ | $\frac14$ | $(\frac12,\frac14)$ |
| $1$ | $1$ | $(1,1)$ |
| $2.3$ | $5.29$ | $(2.3,5.29)$ |
| $\pi$ | $\pi^2$ | $(\pi,\pi^2)$ |

The picture of all the points of the form $\,(x,x^2)\,$ is called the graph of the squaring function.
Now it's time to make things precise:
Let $\,f\,$ be a function with domain $\,\text{dom}(f)\,.$
The graph of $\,f\,$ is the picture of all its (input,output) pairs.
Precisely:
$$ \cssId{s42}{\text{graph of } f = \{(x,f(x))\ |\ x\in\text{dom}(f)\} } $$(Read this aloud as: ‘The graph of $\,f\,$ is the set of all points of the form $\,x\,,$ comma, $\,f\,$ of $\,x\,,$ with the property that $\,x\,$ is in the domain of $\,f\,.$ ’)
When you graph a function:
- the inputs (the first coordinates of the points) are placed along the $\,x$-axis;
- the outputs (the second coordinates of the points) are placed along the $\,y$-axis.
The graph itself should then be labeled $\,y=f(x)\,$; this indicates that the $\,y$-value of each point is the output from the function $\,f\,$ when the input is $\,x\,.$
Different names (other than $\,x\,$ and $\,y\,$) may certainly be used for the inputs and outputs; the graph should be labeled accordingly.
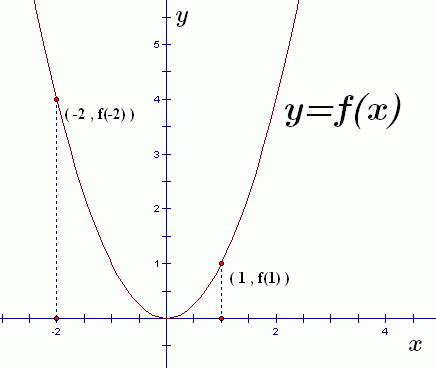
The sketch below illustrates all the key features of a graph.
- The input (horizontal) axis is labeled as $\,x\,.$
- The output (vertical) axis is labeled as $\,y\,.$
- The graph itself is labeled as $\,y = f(x)\,.$
A couple specific (input,output) pairs are shown.

You should recognize this as the graph of the squaring function. That is, $\,f(x) = x^2\,.$ Thus:
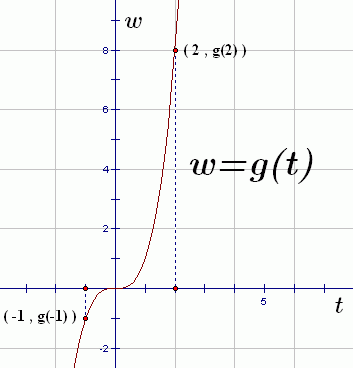
Alternative names for inputs and outputs have been chosen for the graph below:

- The input (horizontal) axis is labeled as $\,t\,.$
- The output (vertical) axis is labeled as $\,w\,.$
- The graph itself is labeled as $\,w=g(t)\,.$ This says that a function named $\,g\,$ is acting on inputs named $\,t\,$ and producing outputs named $\,w\,.$
A couple specific (input,output) pairs are shown.
You may have guessed that this is the graph of the cubing function. That is, $\,g(t) = t^3\,.$ Thus:
$$ \begin{gather} \cssId{s72}{g(-1) = (-1)^3 = -1}\cr \text{and}\cr \cssId{s73}{g(2) = 2^3 = 8} \end{gather} $$Two Ways to Ask the Same Question
Here are two things you will frequently be asked to do:
-
Graph the function $\,f(x) = x^2\,.$
Or, more simply: Graph $\,f(x) = x^2\,.$
Or, slightly more correctly: Graph the function $\,f\,$ defined by $f(x ) = x^2\,.$
Here, you're being asked for a picture of all the (input,output) pairs for $\,f\,.$ That is, you're being asked for a picture of all the points of the form $\,(x,f(x)) = (x,x^2)\,.$
-
Graph the equation $\,y = x^2\,.$
Or, more simply: Graph $\,y = x^2\,.$
The sentence ‘$\,y= x^2\,$’ is an equation in two variables. To graph this sentence means to show all the choices for $\,x\,$ and $\,y\,$ that make it true. Thus, you are being asked to show a picture of all the points of the form $\,(x,y) = (x,x^2)\,.$
Two different-sounding questions, but exactly the same answer. It's very important that you are comfortable with these interchangeable ways that you might be asked for a graph.
Example: Reading Information From a Graph
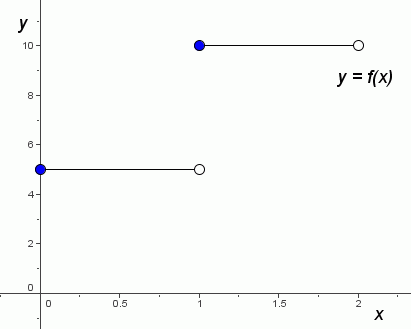
The graph of a function $\,f\,$ is shown below.

Read the following information from the graph:
- $f(1)$
- $f(\frac12)$
- $f(1+0.0001)$
- $f(1)+f(0.0001)$
Solutions
-
$f(1)=10$
A solid (filled-in) dot indicates that a point is actually there; it indicates an (input,output) pair. A hollow (empty; not filled-in) dot indicates that a point is not there.
- $f(\frac12)=5$
- $f(1+0.0001)=f(1.0001)=10$
- $f(1)+f(0.0001)=10+5=15$