 Exponential Growth and Decay: Relative Growth Rate
In the prior section, Exponential Growth and Decay: Introduction, we learned that most people use the function $\,P(t) = P_{0}\,{\text{e}}^{rt}\,$ to model exponential growth or decay, where:
- $P(t) = \text{the population at time $\,t$}$
-
$\begin{align} P_{0} &= \text{the initial population}\cr &= \text{the population at time $\,0$} \end{align}$ - The constant $\,r\,$ is called the relative growth rate
This section gives additional information about the family of functions, $P(t) = P_{0}\,{\text{e}}^{rt}\,,$ and also explores the relative growth rate.
Increasing/Decreasing Properties of $\,{\text{e}}^{rt}\,$
As illustrated below:
- $\,r \gt 0\,$: $\,y = {\text{e}}^{rt}\,$ is increasing; these are exponential growth functions
- $\,r \lt 0\,$: $\,y = {\text{e}}^{rt}\,$ is decreasing; these are exponential decay functions
- $\,y = {\text{e}}^{2t}\,$ and $\,y = {\text{e}}^{-2t}\,$ (and similar pairs) are symmetric about the $y$-axis (if needed, review reflection about the vertical axis)
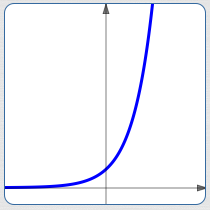
$r \gt 0\,$:
$y = {\text{e}}^{rt}\,$ is increasing
(exponential growth)
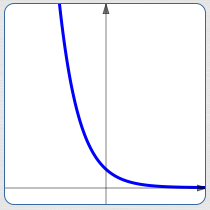
$r \lt 0\,$:
$y = {\text{e}}^{rt}\,$ is decreasing
(exponential decay)
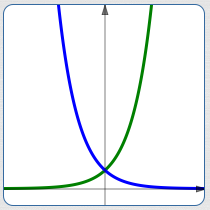
pairs like $\,\color{green}{y = {\text{e}}^{2t}}\,$ and $\,\color{blue}{y = {\text{e}}^{-2t}}\,$ are symmetric about the $y$-axis
How Fast Does an Exponentially Growing Population Increase?
For exponential growth:
- When a population is small, it increases slowly
- When a population is large, it increases quickly
The relative growth rate will make this observation mathematically precise.
Relative Growth Rate
First, we borrow some Calculus results:
- The derivative of a function gives the slopes of the tangent lines to the graph of the function. Using ‘prime notation’, the derivative of $\,P(t)\,$ is denoted by $\,P'(t)\,,$ and is read aloud as ‘$P\,$ prime of $\,t\,$’.
- As discussed in Introduction to Instantaneous Rate of Change and Tangent Lines, the slope of the tangent line tells how fast the outputs from the function are changing, at the instant you pass through a point.
- The derivative of $\,P(t) = P_{0}\,{\text{e}}^{rt} \,$ is: $$\begin{align} P'(t) &= P_{0}(r{\text{e}}^{rt})\cr &= r\bigl(P_{0}\,{\text{e}}^{rt}\bigr)\cr &= rP(t) \end{align} $$
Putting this all together, for $\,P(t) = P_{0}\,{\text{e}}^{rt} \,$:
The rate at which the population is changing (i.e., the growth rate) is proportional to the current population size, and the proportionality constant is $\,r\,.$
$$ \begin{gather} \cssId{s34}{\overbrace{P'(t)\strut }^{\text{the rate at which the population is changing}}}\cr \cssId{s35}{\ \ =\ \ \strut}\cr \cssId{s36}{\overbrace{r\strut }^{\text{is proportional to}\ \ \ \ }\cdot } \cssId{s37}{\overbrace{P(t)\strut}^{\text{the current population size}}} \end{gather} $$Note:
- $P(t)\,$ is always positive, so $\,P'(t) = rP(t)\,$ has the same sign as $\,r$
- If $\,r \gt 0\,,$ then $\,P'(t) \gt 0\,$ and the population is increasing (growing)
- If $\,r \lt 0\,,$ then $\,P'(t) \lt 0\,$ and the population is decreasing (shrinking)
The Rate at Which the Population Grows/Shrinks Depends On Its Current Size
The rate at which the population $\,P(t) = P_{0}\,{\text{e}}^{rt} \,$ is growing or shrinking depends on its current size! In other words, the growth rate is relative to the current population. For this reason, the proportionality constant $\,r\,$ is called the relative growth rate.
Graphical Understanding of the Relative Growth Rate
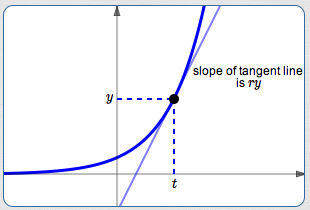
Let $\,(t,\color{red}{y})\,$
be any point on the graph of $\,P(t) = P_{0}\,{\text{e}}^{\color{red}{r}t}\,,$
as shown below.
The slope of the tangent line at this point is $\,\color{red}{ry}\,.$
This slope depends on two things:
- the $y$-value of the point
- the constant $\,r\,$ (the relative growth rate)
Units of the Relative Growth Rate
What are the units of the relative growth rate, $\,r\,$?
Answer:
Here are some examples:
- If time is measured in days, then the units of $\,r\,$ are $\,\frac{1}{\text{day}}\,$ (‘per day’).
- If time is measured in years, then the units of $\,r\,$ are $\,\frac{1}{\text{year}}\,$ (‘per year’).
-
If $\,r = 0.12 = 12\%\,$ and time is measured in seconds, then the relative growth rate is $\,12\%\,$ per second. By itself, this is incomplete—$12\%\,$ of what per second?
Multiplying $\,r\,$ by $\,y\,$ (the current population size) resolves this problem! Then, $\,ry\,$ is the current growth rate, which (in this example) is $\,12\%\,$ of the current population per second.
Example
Suppose that $\,P(t) = 100{\text{e}}^{0.12t}\,$ gives the number of people at time $\,t\,,$ where $\,t\,$ is measured in years. Then:
- The initial population is $\,100\,$: $\,P(0) = 100$
- The relative growth rate is the number multiplying $\,t\,$ in the exponent: $\,r = 0.12 = 12\%\,$ per year. At every instant, the population is growing at a rate equal to $\,12\%\,$ of its current size per year.
How fast is the population growing at time zero?
$$\cssId{s70}{rP(0) = (0.12)(100) = 12}$$At $\,t = 0\,,$ the population is growing at the rate of $\,12\,$ people per year.
Based on the calculation above, about how many people do you expect to have after one year?
$$\cssId{s73}{100 + 12 = 112}$$After one year, we expect to have about $\,112\,$ people.
What is the exact population after one year?
$$\cssId{s76}{P(1) = 100{\text{e}}^{0.12(1)} \approx 112.7 \approx 113}$$Why is the exact population slightly bigger than the estimate?
As soon as you move away from a point, the growth rate changes! In other words, the growth rate changes as the population changes.
As soon as the population increases (say, from $\,100\,$ to $\,101\,$ people), then the growth rate increases, too!
Careful with Language: ‘Relative Growth Rate’ versus ‘Growth Rate’
Be careful to distinguish between two similar-sounding concepts:
-
Relative growth rate:
This is a constant. It is the number $\,r\,$ in the population model $\,P(t) = P_{\,0}{\text{e}}^{rt}\,.$
-
Growth rate:
This is the slope of the tangent line to a point on the graph of a population model. The growth rate changes as you move from point to point; it is not constant.
For the population model $\,P(t) = P_{0}\,{\text{e}}^{rt}\,,$ the growth rate is $\,rP(t)\,.$ That is:
$$ \begin{align} &\cssId{s91}{\text{growth rate at time $\,t\,$}}\cr &\ \ =\ \ \strut \cssId{s92}{(\overbrace{\text{relative growth rate}}^{\text{constant}})} \cssId{s93}{(\overbrace{\text{population size at time $\,t\,$}}^{\text{variable}})} \end{align} $$
The word ‘relative’ is important!