 Reading Information from the Graph of a Function
Suggested Review: Graphs of Functions from the Algebra II curriculum
You must be able to read a wide variety of information from the graph of a function:
- Function values
- Function values on lines between two known points
- Domain of the function (using correct set notation)
- Range of the function (using correct set notation)
- Where the function increases/decreases/is constant
- Sets of inputs for which the output has specified properties
Example
The graph of a function $\,f\,$ is given below.
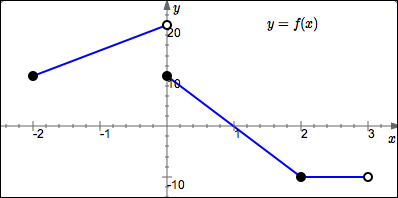
$f(0) = 10$
$f(1) = 0$
$f(2.03) = -10$
$\text{dom}(f) = [-2,3)$
$\text{ran}(f) = [-10,20)$
$f$ increases on $[-2,0)$
$f$ decreases on $[0,2]$
$f$ is constant on $[2,3)$
$\{x\ |\ f(x) = 10\} = \{-2,0\}$
$\{t\ |\ f(t) \gt 0\} = [-2,1)$
How can we tell this is the graph of a function?
It passes the vertical line test.
Concept Practice
In the graphs, all black points are plotted on grid lines. That is, both the $x$-values and $y$-values are integers.
For green points, you're only guaranteed that the $x$-value is an integer. Round any computed $y$-values to three decimal points (as needed).