 Introduction to Average Rate of Change
This section gives an informal introduction to average rate of change, which is important in Calculus.
You must understand rate of change to fully appreciate the special property of the natural exponential function.
Average Rate of Change
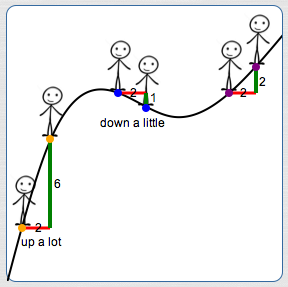
In an earlier section we talked about ‘walking along a curve’ and paying attention to how the ‘elevation’ changes.

In taking each ‘step’ along the curve (above), the horizontal movements (shown in red) and the vertical movements (shown in green) allow you to compute a number which gives information about how fast, on average, the vertical position along the curve is changing. This number is called average rate of change:
$$ \begin{align} &\cssId{s10}{\text{average rate of change}}\cr\cr &\qquad = \frac{\text{change in vertical}}{\text{change in horizontal}}\cr\cr &\qquad = \cssId{s11}{\frac{\Delta y}{\Delta x}} \end{align} $$
For vertical movements:
up is positive, down is negative
For horizontal movements:
to the right is positive,
to the left is negative

(Numbers indicate lengths of segments)
Let's do some computations. It doesn't matter if you move from left to right, or right to left. The average rate of change computation is the same. Why? Average rate of change between two points is just the slope of the line between the two points!
Movement Left to Right
Left-most step (orange dot to orange dot):
Middle step (blue dot to blue dot):
Right-most step (purple dot to purple dot):
Movement Right to Left
Left-most step (orange dot to orange dot):
Middle step (blue dot to blue dot):
Right-most step (purple dot to purple dot):
What's the Difference Between Finding the Slope of a Line or an Average Rate of Change?
Given two points $\,A(x_1,y_1)\,$ and $\,B(x_2,y_2)\,,$ you use exactly the same formula for:
- the slope of the line between $\,A\,$ and $\,B\,$: $$\cssId{s40}{ m = \frac{y_2-y_1}{x_2-x_1}}$$
- the AVerage Rate Of Change between $\,A\,$ and $\,B\,$: $$\cssId{s42}{\text{AVROC} = \frac{y_2-y_1}{x_2-x_1}}$$
However, the emphasis is often different.
When you're finding the slope of a line, you're often interested in its visual ‘steepness’. Are you going uphill? Downhill? Are you at a steep part of a curve or a gradual part?
When you're finding an average rate of change, you're often trying to understand how outputs are changing as inputs change. Are the outputs increasing? Decreasing? Quickly? Slowly?
What is ‘Average’ about Average Rate of Change?
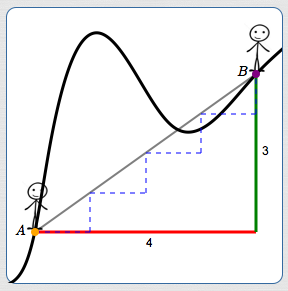
On the curve below, the average rate of change between points $\,A\,$ and $\,B\,$ is: $$\frac{\color{green}{3 \text{ up}}}{\color{red}{4 \text{ right}}} = \frac{3}{4}$$

Imagine walking along the thick black curve above from point $\,A\,$ to point $\,B\,.$ Sometimes you're going uphill, sometimes downhill. However, by the time you've completed the journey, you've moved $\,3\,$ units up and $\,4\,$ units to the right.
Alternatively, imagine that you're in a pitch black room. A light flashes, showing you at point $\,A\,.$ Then, it goes pitch black again. A light flashes a second time, showing you at point $\,B\,.$ Can someone watching know exactly how you got from $\,A\,$ to $\,B\,$? No! It was dark! All they know is that, overall, you moved $\,3\,$ units up and $\,4\,$ units to the right.
Look at the blue dashed segments on the picture. To accomplish your ‘journey’ from $\,A\,$ to $\,B\,$ in a very boring way, you could follow these dashed segments:
- One unit to the right, $\,3/4\,$ unit up.
- One unit to the right, $\,3/4\,$ unit up.
- One unit to the right, $\,3/4\,$ unit up.
- One unit to the right, $\,3/4\,$ unit up.
On average, in moving from $\,A\,$ to $\,B\,,$ you move $\,\frac 34\,$ units up for each unit to the right!

On average, in moving from $\,A\,$ to $\,B\,,$ you move $\,\frac 34\,$ units up for each unit to the right!
Average Rate of Change of a Function on an Interval
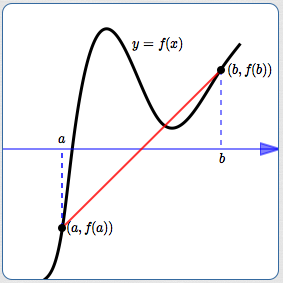
The average rate of change of a function $\,f\,$ on an interval $\,[a,b]\,$ is the slope of the line between the points $\,(a,f(a))\,$ and $\,(b,f(b))\,$:
$$ \begin{align} &\cssId{s74}{\text{average rate of change of $\,f\,$ on $\,[a,b]\,$}}\cr\cr &\quad \cssId{s75}{= \text{slope of line between $\,(a,f(a))\,$ and $\,(b,f(b))\,$}}\cr\cr &\quad \cssId{s76}{= \frac{f(b) - f(a)}{b - a}} \end{align} $$
The black curve is the graph of $\,f\,.$
The average rate of change of $\,f\,$ on $\,[a,b]\,$ is the slope of the red line.
What Exactly Do You Need to Know to Compute Average Rate of Change?
You should be able to compute average rate of change in all the following situations:
Known Changes in $\,x\,$ and $\,y\,$
GIVEN:
a change in ‘outputs’ $\,\Delta y\,$
and
a change in
‘inputs’ $\,\Delta x\,$
AVERAGE RATE OF CHANGE:
$\displaystyle\,\frac{\Delta y}{\Delta x}$
Two Points Known
GIVEN:
two points
$\,A(x_1,y_1)\,$ and $\,B(x_2,y_2)\,$
AVERAGE RATE OF CHANGE:
$\displaystyle\,\frac{y_2 - y_1}{x_2 - x_1}$
Known Function and Interval
GIVEN:
a function $\,f\,$ and an interval $\,[a,b]\,$
AVERAGE RATE OF CHANGE:
$\displaystyle\,\frac{f(b) - f(a)}{b - a}$