Average Rate of Change
Here is an index card that goes with this lesson (side 1a only). The ideas are discussed more fully below. That's my own handwriting, to show you that it really fits onto a 4in x 6in index card!
You may want to copy this information onto your own index card, to have an in-a-nutshell summary of important calculus ideas.
You can get an entire set of Calculus Index Cards here. Hold an entire Calculus course in the palm of your hand!
Recall that a function is a rule that takes an input, does something to it, and gives a corresponding output.
Function notation is extremely useful for describing this input/output relationship: if the function name (the rule) is $\,f\,,$ and the input is $\,x\,,$ then the corresponding output is $\,f(x)\,.$
That is, the notation $\,f(x)\,$ (read as ‘$f$ of $x$’) represents the output from the function $\,f\,$ when the input is $\,x\,.$
As inputs change, you often want to know how the corresponding outputs (function values) change. That is, as inputs change from $\,a\,$ to $\,b\,,$ how is $\,f(a)\,$ changing to $\,f(b)\,$? Are these outputs increasing? Decreasing? Quickly? Slowly?
Motivating Example: Dial Controlling Shower Water Temperature
Here's an example. Suppose you have a shower dial that controls the temperature of the water. How do adjustments of the dial (changes in the input) affect the temperature of the water (changes in the output)?
When you move the dial from (say) position $\,a\,$ to position $\,b\,,$ does the water get hotter or colder? (Perhaps the dial is broken, and the temperature doesn't change at all!)
Does moving the dial from $\,a\,$ to $\,b\,$ change the temperature a lot, or only a little? These are the sorts of questions we want answered, and the concept of average rate of change comes to the rescue.

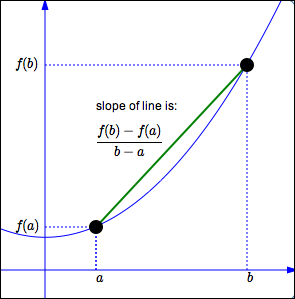
The average rate of change of $\,f\,$ from $\,a\,$ to $\,b\,$ is:
$$\frac{f(b) - f(a)}{b - a}$$Observations on the Definition
Different Names for Average Rate of Change
- The average rate of change of $\,f\,$ from $\,a\,$ to $\,b$
- The average rate of change of $\,f\,$ on the interval $\,[a,b]$
- The average rate of change of $\,f\,$ between $\,a\,$ and $\,b$
Numerator and Denominator of Average Rate of Change
- The denominator, $\,b - a\,,$ gives the change in the inputs.
- The numerator, $\,f(b)-f(a)\,,$ gives the corresponding change in the outputs.
Delta Notation for Changes in a Quantity
The uppercase Greek letter delta ($\,\Delta\,$) denotes a change in a quantity.
For example, ‘$\,\Delta x\,$’ can be read as ‘change in $\,x\,$’ or ‘delta $\,x\,$’, and denotes a change in $\,x\,.$
Average Rate of Change with Delta Notation
The average rate of change of a function $\,f\,$ takes the form:
$$\frac{\Delta{\text{ output}}}{\Delta{\text{ input}}} = \frac{\Delta f(x)}{\Delta x} $$Average Rate of Change as a Slope
The slope of the line through the points $\,(a,f(a))\,$ and $\,(b,f(b))\,$ is:
$$\frac{\text{rise}}{\text{run}} = \frac{\Delta y}{\Delta x} = \frac{f(b)-f(a)}{b-a} $$This is the average rate of change formula!
The average rate of change of $\,f\,$ from $\,a\,$ to $\,b\,$ is equal to the average rate of change of $\,f\,$ from $\,b\,$ to $\,a\,$:
$$ \overbrace{\frac{f(b)-f(a)}{b-a}}^{\text{from $a$ to $b$}} \cdot\frac{-1}{-1} = \overbrace{\frac{f(a)-f(b)}{a-b}}^{\text{from $b$ to $a$}} $$This makes sense, since the slope of the line through two points $\,P_1\,$ and $\,P_2\,$ is the same as the slope of the line through $\,P_2\,$ and $\,P_1\,.$
Units of Average Rate of Change
The units of average rate of change are the units of the output divided by the units of the input.
That is, the units of average rate of change are the units of $\,f(x)\,$ divided by the units of $\,x\,.$
For example, if $\,f(t)\,$ measures the position of a particle on a number line (in feet) at time $\,t\,$ (in seconds), then the units of average rate of change are ‘feet per second’. In this case, the average rate of change is the average velocity of the particle on the interval of interest.
Example: A Particle Moving Along a Number Line
A particle is moving along a number line. Let $\,s(t)\,$ (in feet) give the position of the particle at time $\,t\,$ (in seconds). Here are some values of $\,t\,$ and $\,s(t)\,$:
| $t$ | $0$ | $1$ | $2$ | $3$ | $4$ | $5$ |
| $s(t)$ | $10$ | $9$ | $7$ | $4$ | $0$ | $-5$ |
(a) Find the average velocity of the particle on $\,[0,2]\,.$ Use correct units.
Answer:
$$ \begin{align} &\frac{\text{change in position}}{\text{change in time}}\cr\cr &\qquad = \frac{s(2)-s(0)}{2-0}\cr\cr &\qquad = \frac{7-10}{2}\cr\cr &\qquad = -\frac 32 \end{align} $$The average velocity is $-\frac 32$ feet/second.
(b) Since we only have ‘snapshots’ of the particle at one-second intervals, it is impossible to know exactly how it is moving. From the limited data, however, how does the particle appear to be moving?
Answer: The particle appears to be moving to the left, and speeding up. In the first second, it moved one unit to the left; in the next second, it moved two units to the left, and so on.
Explore Average Rate of Change (AVROC) Below
Input a desired polynomial function $\,f\,$ and interval $\,[a,b]\,$ (with $\,a \lt b\,$) below.
How to input the function: You must use ‘ * ’ for multiplication. For example, use x*x for $\,x^2\,$ and 5*x for $\,5x\,.$
If the text on the graph is blocking something you want to see, just grab it and move it elsewhere!
$f(x) = $
$a = $
$b = $