 The Graph of an Inverse Function
One-to-one functions and inverse functions are explored in these earlier sections:
- Using a Function Box ‘Backwards’
- One-to-One Functions
- Undoing a One-to-One Function; Inverse Functions
- Properties of Inverse Functions
- Finding Inverse Functions (when there's only one $x$ in the formula)
- Finding Inverse Functions (switch input/output names method)
If a point $\,(a,b)\,$ is on the graph of a one-to-one function $\,f\,,$ then the point $\,(b,a)\,$ is on the graph of its inverse $\,f^{-1}\,.$ This is because the input/output roles for a function and its inverse are switched—an input to one is an output from the other.
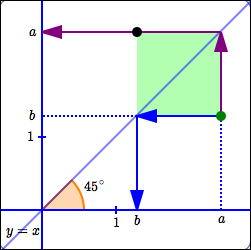
As discussed below, the point $\,(b,a)\,$ is found by reflecting the point $\,(a,b)\,$ about the line $\,y = x\,,$ when graphed in a coordinate system where ‘$\,1\,$’ on the $x$-axis is the same as ‘$\,1\,$’ on the $y$-axis.
From this observation, we will see below that the graph of an inverse function is very easy to obtain if we have the graph of the original function—just reflect the original graph about the line $\,y = x\,.$
Finding a Point $\,(b,a)\,$ from a Given Point $\,(a,b)\,$

-
Start with a coordinate system where ‘$\,1\,$’ on the $x$-axis is the same as ‘$\,1\,$’ on the $y$-axis. This forces distances measured on either axis to have exactly the same length.
Also, the line $\,y = x\,$ (which has slope $\,1\,$) will be at a $\,45^{\circ}\,$ angle in such a coordinate system.
- Plot a point $\,(a,b)\,.$ This is the big green point in the diagram above.
-
Locate the number $\,b\,$ on the $x$-axis, as follows (use the blue arrows):
- Go from the green point, horizontally, to the line (horizontal blue arrow).
- Points on the line $\,y = x\,$ have the same $\,x\,$ and $\,y\,$ values.
- Since we know this point has $y$-value equal to $\,b\,,$ its $x$-value must also be $\,b\,.$
- Mark $\,b\,$ on the $x$-axis (vertical blue arrow).
-
Locate the number $\,a\,$ on the $y$-axis, as follows (use the purple arrows):
- Go from the green point, vertically, to the line (vertical purple arrow).
- Points on the line $\,y = x\,$ have the same $\,x\,$ and $\,y\,$ values.
- Since we know this point has $x$-value equal to $\,a\,,$ its $y$-value must also be $\,a\,.$
- Mark $\,a\,$ on the $y$-axis (horizontal purple arrow).
- Observe that the green shaded region is a square: all sides have length $\,a - b\,,$ and all angles are $\,90^{\circ}\,.$ The desired point $\,(b,a)\,$ (large black point) has been located as the corner of the square opposite the original green point.
- When you fold a square along a diagonal, the opposite corners meet. Thus, the green and black dots will coincide after folding.
- Based on these results, simplify the process: to get from the green point to the black point, just fold along the line $\,y = x\,.$ That is, to get from a point $\,(a,b)\,$ to a point $\,(b,a)\,,$ just fold along the line $\,y = x\,.$
-
Notice that the line $\,y = x\,$
is the perpendicular bisector
of the segment connecting the original point $\,(a,b)\,$ and the reflected point $\,(b,a)\,.$
The Graph of an Inverse Function
By definition, the graph of a function is the set of all its input/output pairs, as the inputs vary over the domain.
Thus: $$ \begin{align} &\cssId{s40}{\text{the graph of } f^{-1}}\cr &\qquad \cssId{s41}{= \{(x,f^{-1}(x))\ |\ x\in\text{dom}(f^{-1})\}}\ \end{align} $$
Since $\,x\,$ is a dummy variable, this set can also be written using the dummy variable $\,y\,$: $$ \begin{align} &\cssId{s44}{\text{the graph of } f^{-1}}\cr &\qquad \cssId{s45}{= \{(y,f^{-1}(y))\ |\ y\in\text{dom}(f^{-1})\}} \end{align} $$
Now, we have:
$$ \begin{align} &\cssId{s47}{\text{the graph of $\,f^{-1}\,$}}\cr\cr &\quad \cssId{s48}{= \{(y,f^{-1}(y))\ |\ y\in\text{dom}(f^{-1})\}}\cr &\qquad\ \ \cssId{s49}{\text{(definition of the graph of a function)}}\cr\cr &\quad \cssId{s50}{= \{(y,f^{-1}(y))\ |\ y\in\text{ran}(f)\}}\cr &\qquad\ \ \cssId{s51}{\text{(since $\text{ran}(f) = \text{dom}(f^{-1})$)}}\cr\cr &\quad \cssId{s52}{= \{(f(x),x)\ |\ x\in\text{dom}(f)\}} \end{align} $$For the last step:
$y\in\text{ran}(f)\,$
if and only if
there exists $\,x\in\text{dom}(f)\,$ such that $\,f(x) = y$
And: $$ \begin{gather} f(x) = y\cr \text{if and only if}\cr x = f^{-1}(y) \end{gather} $$
Thus, the graph of $\,f^{-1}\,$ is precisely the set of points that make up the graph of $\,f\,,$ but with the coordinates switched!
We've already seen that ‘switching coordinates’ is accomplished by reflecting about the line $\,y = x\,$ in a coordinate system where the scales on the horizontal and vertical axes are identical. Thus, we have:
Let $\,f\,$ be a one-to-one function, so that it has an inverse $\,f^{-1}\,.$
The graph of $\,f^{-1}\,$ is found as follows:
- Create a coordinate system where ‘$1$’ on the $x$-axis is the same as ‘$1$’ on the $y$-axis.
- Graph $\,f\,$ in this coordinate system.
- Reflect (‘mirror’) the graph of $\,f\,$ about the line $\,y = x\,.$
- The reflected graph is the graph of $\,f^{-1}\,.$
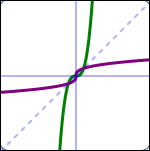
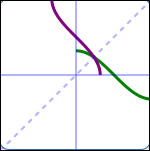
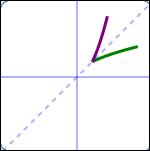
Several different one-to-one functions and their reflections in the line $\,y = x\,$ are shown below:


