 Graphs of Sine and Cosine
The graphs of the sine and cosine functions are shown below.
- Where do these graphs come from?
- Important characteristics of the graphs
- Two trigonometric identities
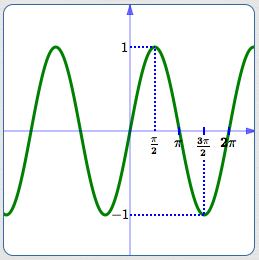
Graph of $\,y = \sin x$
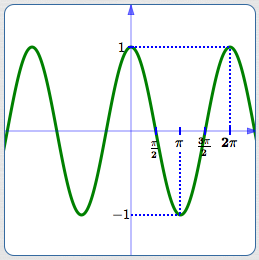
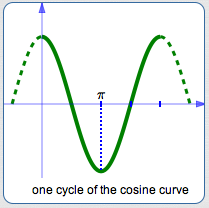
Graph of $\,y = \cos x$
Where Do These Graphs Come From?
The sine function gives the $y$-values of points on the unit circle.
The cosine function gives the $x$-values of points on the unit circle.
Since the unit circle has radius $\,1\,,$ all its points have coordinates between $\,-1\,$ and $\,1\,.$ That's why both graphs (sine and cosine) are trapped between $\,y = -1\,$ and $\,y = 1\,.$
Visualizing the Graph of the Sine Function
Here's a way you can visualize the graph of the sine function:
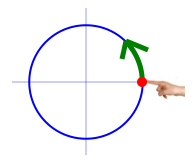
Put your finger at the point $\,(1,0)\,$ on the unit circle. Twirl it around the circle counter-clockwise (start UP). The sine function tracks your finger's up/down motions:
A Higher Level of Understanding for the Sine Function
In Radian Measure, we ‘wrap’ the real number line around the unit circle. In this way, every real number is associated with a point (called the terminal point) and a corresponding angle on the unit circle. The real number is then the radian measure of this angle!
Wrap the real number line around the unit circle!
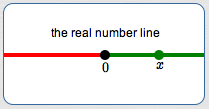
Thus, every real number $\,x\,$ ...
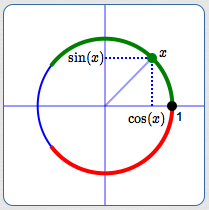
... is associated with a point on the unit circle ...
... and a corresponding angle.
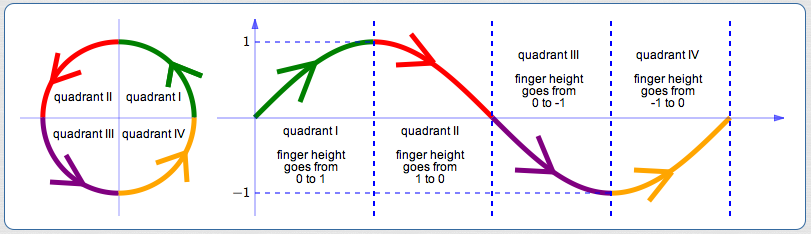
In The Unit Circle Approach to Trigonometry, we saw that $\,\sin(x)\,$ is the $y$-value of the terminal point:
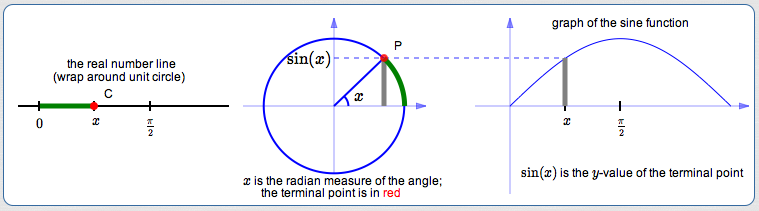
As $\,x\,$ goes from $\,0\,$ to $\,\frac{\pi}{2}\,,$
$\,\sin x\,$ goes from $\,0\,$ to $\,1\,.$
(Remember: $\,\frac{\pi}{2}\,$ radians is
$\,90^\circ\,$)
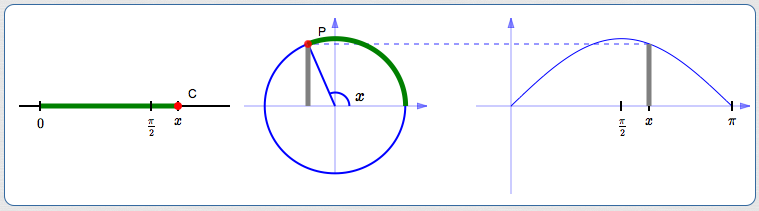
As $\,x\,$ goes from $\,\frac{\pi}{2}\,$ to $\,\pi\,,$
$\,\sin x\,$ goes from $\,1\,$ back to $\,0\,.$
(Remember: $\,\pi\,$ radians is
$\,180^\circ\,$)
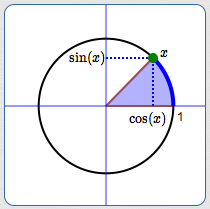
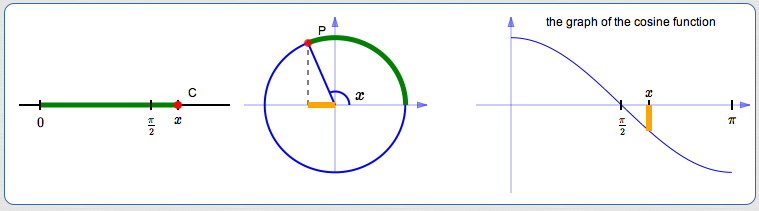
The Cosine Function
The entire discussion can be repeated to understand the cosine—except that it gives the $x$-values of the points, not the $y$-values!
Here's how one of the graphics above would be adjusted to focus attention on the $x$-value:
Important Characteristics of the Graphs
Properties of both sine and cosine:
Domain and Range
- Domain is $\Bbb R$ (Recall that $\,\Bbb R\,$ represents the set of real numbers.)
- Range is the interval $[-1,1]$
Period
- The period is $\,2\pi\,$
-
Sine has period $\,2\pi\,$: $\,\sin(x+2\pi) = \sin x\,$ for all real numbers $\,x\,.$
More generally: $\,\sin(x+2\pi k) = \sin x\,$ for all integers $\,k\,$ and all real numbers $\,x\,.$
-
Cosine has period $\,2\pi\,$: $\,\cos(x+2\pi) = \cos x\,$ for all real numbers $\,x\,.$
More generally: $\,\cos(x+2\pi k) = \cos x\,$ for all integers $\,k\,$ and all real numbers $\,x\,.$
Two Trigonometric Identities
Take the sine curve and shift it $\,\frac{\pi}{2}\,$ units to the left—it turns into the cosine curve:
$$ \cssId{s50}{\sin(x + \frac{\pi}{2}) = \cos x} $$Take the cosine curve and shift it $\,\frac{\pi}{2}\,$ units to the right—it turns into the sine curve:
$$ \cssId{s52}{\cos(x - \frac{\pi}{2}) = \sin x} $$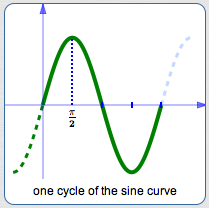
Thus, we have two new trigonometric identities! For all real numbers $\,x\,$:
$$ \begin{gather} \cssId{s55}{\sin(x + \frac{\pi}{2}) = \cos x}\cr\cr \cssId{s56}{\cos(x - \frac{\pi}{2}) = \sin x} \end{gather} $$