 Recognizing Linear and Exponential Behavior from Tables of Data
The purpose of this section is to gain experience distinguishing between linear and exponential behavior, by recognizing the defining behaviors from small tables of input/output pairs.
Recall from the previous section:
For linear functions, $\,f(x) = mx + b\,,$ we have:
- $f(x+\Delta x) = f(x) + m\Delta x$
- That is, the outputs change $\,m\,$ times faster than the inputs.
- That is, when the inputs change by $\,\Delta x\,,$ the outputs change by $\,m\Delta x\,.$
For exponential functions, $\,f(x) = a^x\,$ (where $\,a \gt 0\,,$ $\,a\ne 1\,$), we have:
- $f(x+\Delta x) = a^{\Delta x}\cdot f(x)$
- That is, the current $y$-value gets scaled by $\,a^{\Delta x}\,$ when the input changes by $\,\Delta x\,.$
- That is, the new $y$-value is $\,a^{\Delta x}\,$ times the old $y$-value.
Introducing a vertical scaling constant to an exponential function does not change its property, as follows:
Let $\,g(x) = \color{red}{K}a^x\,,$ where $\,K\,$ is a nonzero real number. Then:
$$ \begin{align} &\cssId{s14}{g(x+\Delta x)}\cr\cr &\quad \cssId{s15}{=\ Ka^{x + \Delta x}}\cr &\qquad\cssId{s16}{\text{(definition of $\,g\,,$ function evaluation)}}\cr\cr &\quad \cssId{s17}{=\ Ka^xa^{\Delta x}}\cr &\qquad \cssId{s18}{\text{(exponent law)}}\cr\cr &\quad \cssId{s19}{=\ a^{\Delta x}(Ka^x)}\cr &\qquad \cssId{s20}{\text{(regroup)}}\cr\cr &\quad \cssId{s21}{=\ a^{\Delta x}g(x)}\cr &\qquad \cssId{s22}{\text{(since $\,g(x) = Ka^x\,$)}} \end{align} $$So ... What Are We Doing In This Section?
You will be given small data sets, like those shown below. Each row represents an (input,output) pair. That is, each row represents a pair $\,(x,f(x))\,$ for a function $\,f\,$ (that you initially do not know).
The $x$-values (the first column) will always be equally spaced and presented in increasing or decreasing order.
There is a function lurking in the background that generated the $y$-values (the second column) in the table. Usually this will be a linear function or an exponential function. However, some other functions might be thrown in, just to keep you on your toes!
Your job is to determine if the data came from a linear or exponential function and then (if possible) find a formula for the generating function.
| $x$ | $g(x)$ |
| $-2$ | $-5$ |
| $-1$ | $-1$ |
| $0$ | $3$ |
| $1$ | $7$ |
| $2$ | $11$ |
| $x$ | $f(x)$ |
| $-2$ | $\displaystyle\frac 29$ |
| $0$ | $2$ |
| $2$ | $18$ |
| $4$ | $162$ |
Example: Recognizing Linear Behavior From a Table of Data
| $\color{red}{x}$ | $\color{blue}{g(x)}$ |
| $\color{red}{-2}$ | $\color{blue}{-5}$ |
| $\color{red}{-1}$ | $\color{blue}{-1}$ |
| $\color{red}{0}$ | $\color{blue}{3}$ |
| $\color{red}{1}$ | $\color{blue}{7}$ |
| $\color{red}{2}$ | $\color{blue}{11}$ |
Check that the $x$-values are equally-spaced, and determine $\,\Delta x\,$ (the change in $\,x\,$)
- Going from $\,\color{red}{-2}\,$ to $\,\color{red}{-1}\,$ increases $\,x\,$ by $\,1\,.$
- Going from $\,\color{red}{-1}\,$ to $\,\color{red}{0}\,$ increases $\,x\,$ by $\,1\,.$
- Going from $\,\color{red}{0}\,$ to $\,\color{red}{1}\,$ increases $\,x\,$ by $\,1\,,$ and so on.
Yes, the $x$-values are equally spaced, and $\,\Delta x = 1\,.$
Look at the corresponding $y$-values. Are they equally spaced?
- Going from $\,\color{blue}{-5}\,$ to $\,\color{blue}{-1}\,$ increases $\,y\,$ by $\,4\,.$
- Going from $\,\color{blue}{-1}\,$ to $\,\color{blue}{3}\,$ increases $\,y\,$ by $\,4\,.$
- Going from $\,\color{blue}{3}\,$ to $\,\color{blue}{7}\,$ increases $\,y\,$ by $\,4\,,$ and so on.
Yes, the $y$-values are equally spaced, and $\,\Delta y = 4\,.$
Determine that equal changes in $\,x\,$ give rise to equal changes in $\,y\,.$ This is linear behavior!
When $\,x\,$ changes by $\,1\,,$ $\,y\,$ changes by $\,4\,.$ That is, the $y$-values change $\,4\,$ times faster than the $x$-values. That is, the outputs change $\,4\,$ times faster than the inputs. This is linear behavior with a slope of $\,4\,.$
Determine a formula for the linear function
We know that $\,g(x) = mx + b\,,$ with $\,m = 4\,.$ The constant $\,b\,$ is the $y$-intercept. Since the point $\,(0,3)\,$ is given, we see that $\,b = 3\,.$ So, $\,g(x) = 4x + 3\,.$
Check some (or all) points
Be sure to check point(s) that you didn't use in getting the formula!
Does the point $\,(-2,-5)\,$ lie on the graph of $\,g(x) = 4x + 3\,$? Substitute $\,-2\,$ for $\,x\,$:
For simple numbers, you can probably do most of the checks in your head.
Summarizing:
| $x$ | $g(x)$ |
| $\color{red}{-2}$ | $\color{blue}{-5}$ |
| $\color{red}{-1}$ | $\color{blue}{-1}$ |
| $\color{red}{0}$ | $\color{blue}{3}$ |
| $\color{red}{1}$ | $\color{blue}{7}$ |
| $\color{red}{2}$ | $\color{blue}{11}$ |
$\Delta x = 1\,$
$\Delta y = 4\,$
Linear!
$\displaystyle\text{slope} = \frac{\Delta y}{\Delta x} = \frac{4}{1} = 4$
The point $\,(0,3)\,$ tells us that $\,b = 3\,.$
Thus, $\,g(x) = 4x + 3\,.$
Checking all points:
A Table of Data Can Never Give the Full Story!
Be aware that there are infinitely many functions with graphs that pass through any finite set of data points! In these exercises, you're finding a plausible function that could generate the data.
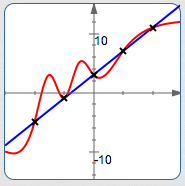
The sketch below shows the line found in the previous example, together with another curve that passes through all the points. Have fun ‘connecting the dots’ to get many others!
A More Compact Example
Here's a second example, with the solution written compactly. In this example, you must solve for the constant $\,b\,,$ since the $y$-intercept is not given in the table.
The Table of Data:
| $x$ | $h(x)$ |
| $-1$ | $-3$ |
| $2$ | $3$ |
| $5$ | $9$ |
| $8$ | $15$ |
Compact Solution:
$\Delta x = 3\,$
$\Delta y = 6\,$
$\displaystyle\text{slope} = \frac{\Delta y}{\Delta x} = \frac{6}{3} = 2$
$\,h(x) = 2x + b\,$
Use $\,(2,3)\,$ to solve
for $\,b\,$:
$3 = 2(2) + b \ \ \Rightarrow\ \ b = -1$
So, $\,h(x) = 2x - 1\,.$
(Mentally check all points.)
Comments:
Be sure to check that $\,\Delta x = 3\,$ for all $x$-values:
Be sure to check that $\,\Delta y = 6\,$ for all $y$-values:
Any point can be used to solve for $\,b\,,$ so choose the easiest to work with.
Recall that ‘$\,\Rightarrow\,$’ is read as ‘implies’.
Example: Recognizing Exponential Behavior From a Table of Data
| $\color{red}{x}$ | $\color{blue}{f(x)}$ |
| $\color{red}{-2}$ | $\displaystyle\color{blue}{\frac 29}$ |
| $\color{red}{0}$ | $\color{blue}{2}$ |
| $\color{red}{2}$ | $\color{blue}{18}$ |
| $\color{red}{4}$ | $\color{blue}{162}$ |
Check that the $x$-values are equally-spaced, and determine $\,\Delta x\,$ (the change in $\,x\,$)
Here, $\Delta x = 2\,.$
Look at the corresponding $y$-values. Are they equally spaced?
If so, the function is linear (see above). If not, the function is nonlinear; go on and check for exponential behavior.
Does a constant multiplying factor take us from $y$-value to successive $y$-value?
What multiplying factor takes us from $\,\frac 29\,$ to $\,2\,$? (Call it $\,n\,.$)
$$ \cssId{s104}{\frac 29\cdot n = 2\ \ \Rightarrow\ \ n = 2\cdot\frac 92 = 9} $$The multiplying factor is $\,9\,.$ Does this same factor work for the remaining $y$-values? Let's check:
$$ \cssId{s108}{2\cdot 9 = 18\ \ \text{and}\ \ 18\cdot 9 = 162} $$Yes! The behavior is exponential, and the multiplying factor is $\,9\,.$
Determine a formula for the exponential function
We know that $\,f(x) = Ka^x\,,$ where $\,a \gt 0\,,$ $\,a\ne 1\,,$ and $\,K\ne 0\,.$ We must determine both $\,a\,$ and $\,K\,.$
$$ \begin{align} &\cssId{s114}{(\color{green}{0},\color{purple}{2}) \text{ on curve }}\cr &\qquad\Rightarrow\ \cssId{s115}{\color{purple}{2} = Ka^{\color{green}{0}}}\cr &\qquad\Rightarrow\ \cssId{s116}{\color{red}{K = 2}}\cr\cr &\cssId{s117}{(\color{green}{2},\color{purple}{18}) \text{ on curve }}\cr &\qquad\Rightarrow\ \cssId{s118}{\color{purple}{18} = \color{red}{2}a^{\color{green}{2}}}\cr &\qquad\Rightarrow\ \cssId{s119}{a^2 = 9}\cr &\qquad\Rightarrow\ \cssId{s120}{a = 3} \end{align} $$Thus, $\,f(x) = 2\cdot 3^x\,.$
Check some (or all) points
Be sure to check point(s) that you didn't use in getting the formula!
Does the point $\,(4,162)\,$ lie on the graph of $\,f(x) = 2\cdot 3^x\,$? Substitute $\,4\,$ for $\,x\,$:
Feel free to use a calculator to help you with the checks.
Summarizing:
| $x$ | $f(x)$ |
| $\color{red}{-2}$ | $\displaystyle\color{blue}{\frac 29}$ |
| $\color{red}{0}$ | $\color{blue}{2}$ |
| $\color{red}{2}$ | $\color{blue}{18}$ |
| $\color{red}{4}$ | $\color{blue}{162}$ |
$\Delta x = 2$
$y$-values are not
equally spaced (not linear)
Multiplying by $\,9\,$
takes us from
$y$-value
to successive
$y$-value,
so it is exponential behavior.
Let $\,f(x) = Ka^x\,.$
$2 = Ka^0\ \ \ \Rightarrow\ \ K = 2$
$18 = 2a^2\ \ \Rightarrow\ \ a = 3$
Thus, $\,f(x) = 2\cdot 3^x\,.$
Checking all points:
Real-life data usually isn't perfect!
Of course, real-life data usually isn't perfect, like the data sets you're working with in this web exercise.
For example, even if, in some experiment, theory predicts that outputs $\,y\,$ should be twice as big as inputs $\,x\,,$ your data points probably won't all satisfy the relationship $\,y = 2x\,$ perfectly.
Instead of a perfect data point like $\,(1,2)\,$ (where the $y$-value is exactly twice the $x$-value), you might have something like $\,(1\,,\,2.1)\,$ or $\,(0.9\,,\,1.7)\,.$ There might be some noise. There might be some error.
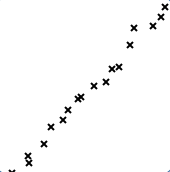
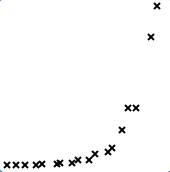
In real life, one way to recognize linear or exponential behavior from points in a data set is by plotting them and observing the graph that results.
Does it look like the points lie on a line? Does it look like the points lie on an exponential curve?
If so, then techniques (such as least squares fitting) can be used to find a ‘fitting’ function that is ‘best’ in a certain mathematical sense. Many handheld graphing calculators can do this kind of curve fitting. The calculations are typically cumbersome and not suited to being done by hand. However, the points don't need to be equally-spaced, and they don't need to be perfect.