 The Test Point Method in a Nutshell, and Additional Practice
The previous four lessons give a thorough discussion of solving inequalities:
- Solving Linear Inequalities in One Variable
- Solving Nonlinear Inequalities in One Variable (Introduction)
- The Test Point Method for Sentences like ‘$\,f(x) \gt 0\,$’
- The Test Point Method for Sentences like ‘$\,f(x) \gt g(x)\,$’
If you want lots of details and practice, it is recommended that you go through all these lessons, in order. Then, this current lesson will give a useful summary and more practice. For those of you who are short on time, though, this current lesson may be all that you need!
Solving Inequalities
Linear inequalities, like $$\frac{3x}{2}-1 \ge \frac 15 - 7x\,,$$
can be solved by using familiar tools to get $\,x\,$ all by itself on one side, and a number on the other side.
The only thing different from working with equations is that if you multiply or divide an inequality by a negative number, then you must change the direction of the inequality symbol.
Nonlinear inequalities, like ‘$\,x^2 \ge 3\,$’, have the variable appearing in a more complicated way. They require more advanced tools—and that's where the ‘test point method’ comes into the picture.
The ‘test point method’ can also be used for linear inequalities, but it's like killing a mosquito with a sledgehammer—that is, you'd be working much harder than needed to accomplish the task.
The ‘test point method’ involves identifying important intervals, and then ‘testing’ a number from each interval—so the name is appropriate.
There are two slightly different ‘flavors’ of the test point method, but only one is discussed here.
Key Ideas for Solving Nonlinear Inequalities
Every inequality can be written in a form with zero on the right hand side. The solution sets (the values of $\,x\,$ that make each sentence true) are determined by which inequality symbol is used:
| Inequality | Solution Set |
| $f(x) > 0$ | value(s) of $\,x\,$ for which the graph of $\,f\,$ is above the $x$-axis |
| $f(x) \ge 0$ | value(s) of $\,x\,$ for which the graph of $\,f\,$ is on or above the $x$-axis |
| $f(x) \lt 0$ | value(s) of $\,x\,$ for which the graph of $\,f\,$ is below the $x$-axis |
| $f(x) \le 0$ | value(s) of $\,x\,$ for which the graph of $\,f\,$ is on or below the $x$-axis |
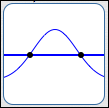
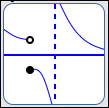
There are only two types of places where the graph of a function $\,f\,$ can go from above to below the $x$-axis (or vice versa). That is, there are only two types of places where a function $\,f\,$ can change its sign (from positive to negative, or vice versa):
- where $f(x) = 0$ (where the graph crosses the $x$-axis)
- at a break in the graph
Try it! Try to draw a graph where you go from above the $x$-axis to below the $x$-axis! How can you do it? Only by crossing through the $x$-axis, or jumping! These special places will be called the candidates for sign changes.
|
|
So, when you need to figure out where a graph is above or below the $x$-axis, just find all the candidates for sign changes. These are the places where it might change from above to below.
In between each of these places, you know the graph is either always above ($\,f(x) \gt 0\,$) or always below ($\,f(x) \lt 0\,$). It can't be sometimes above and sometimes below, because then there would have to be another zero or break. So, choose any number (the test point) to decide which is which!
For example, suppose a function has a zero at $\,x = 1\,$ and a break at $\,x = 3\,.$ That's it—no other zeros or breaks. You've marked these on a number line, like the one shown below.
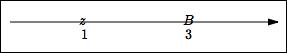
Notice that these two numbers break the number line into three subintervals.
So, what could the graph look like on (say) the subinterval from $\,1\,$ to $\,3\,$? Could the graph be partly above the $x$-axis, and partly below, on this subinterval? No!! Because if it were, then there would have to be another zero or break where it switches—and there aren't any other zeros or breaks.
So, you can pick any number between $\,1\,$ and $\,3\,$ (called the ‘test point’) and check whether you're above or below there—and then you know that this same behavior holds on the entire subinterval. That's the beauty of the test point method!
The Test Point Method
The steps outlined here are for the ‘one function (compare with zero)’ flavor of the test point method.
Solve $\,x^2 + 5x > -6$
Step 1:
- Get zero on one side.
- Identify the function $\,f\,.$
Adding or subtracting the same expression from both sides never changes the direction of the inequality symbol.
Recall that ‘:=’ means ‘equals, by definition’.
Step 2:
- Where is $\,f(x) = 0\,$?
- Where are there break(s) in the graph?
- Mark these places on a number line. Use ‘$\,z\,$’ for zero and ‘$\,B\,$’ for break.
- Label the number line itself as ‘Sign of $f(x)$’.
In this example, there are no breaks in the graph.
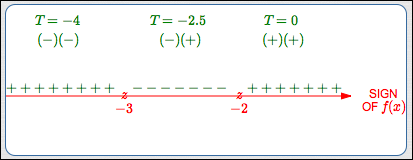
At the end of this step, you should have the red parts of the test point diagram (bottom row of this table).
Step 3:
Test the resulting subintervals.
(These calculations, mostly done mentally, are used to construct the green part of the test point diagram shown below.)
Remember that you only care about the sign of $\,f\,$ on each subinterval, not the exact value. So, don't do more work than you need to!
For example, you could compute
or
and see that it is positive, but that would be working way too hard.
A good rule of thumb—when zero is available as a test point, choose it! Most functions are very easy to evaluate at zero.
At the end of this step, you should have the green parts of the test point diagram (below).
Step 4:
Report the solution set.
$(-\infty,-3)\cup (-2,\infty)$
Sentence Form of Solution Set:
$x \lt -3\ \text{ or }\ x \gt -2$
Interval notation is useful for reporting the solution set.
Recall that parentheses $\,(\ ,\,)\,$ are used to indicate that an endpoint is not included.
The union symbol $\,\cup\,$ (discussed in advanced set concepts) is used to put two sets together.
Step 5 (optional):
Do a ‘spot check’ in the original sentence.
$-4\,$ is in the solution set: $$\begin{gather} \cssId{s116}{(-4)^2 + 5(-4) \overset{?}{\ \gt\ } -6}\cr \cssId{s117}{16 - 20 \overset{?}{\ \gt\ } -6}\cr \cssId{s118}{-4 \gt -6\ \ \text{True!}} \end{gather} $$
$-2.5\,$ is not in the solution set: $$\begin{gather} \cssId{s120}{(-2.5)^2 + 5(-2.5) \overset{?}{\ \gt\ } -6}\cr \cssId{s121}{-6.25 \overset{?}{\ \gt\ } -6\ \ \text{False!}} \end{gather} $$
If you have time, choose some simple values that are in, and not in, your solution set. Substitute them into the original sentence, and check that it is appropriately true/false.
When you're testing values, it's a nice idea to put a question mark over the inequality symbol. You're basically asking a question: Is the sentence true or false?
When a number is in the solution set, your sentence should come out true. When a number isn't in the solution set, your sentence should come out false.
This ‘spot-check’ can give you confidence in your work, and catch mistakes.
Be sure to use the original sentence for this check—you want to catch any mistakes you might have made in manipulating the sentence.
Example: Both Zeros and Breaks
Here's a second example, where the function has both zeros and a break. Only the bare minimum is shown here. When you get good at this method, this is probably all you'll need to write down.
In this example, the choice was made to take a few steps and rename the function $\,f\,$ as a single fraction. Then:
- The only way a fraction can equal zero is when its numerator is zero.
- You can't divide by zero, so any value of $\,x\,$ for which a denominator is zero isn't allowed, and is a break in the graph.
STEP 1:
- Get zero on one side.
- Identify the function $\,f\,.$
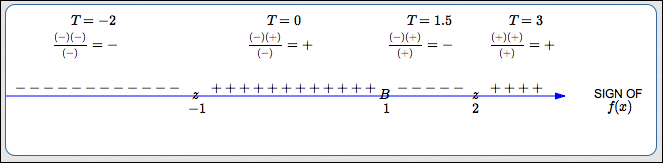
STEP 2:
- Where is $\,f(x) = 0\,$?
- Where are there break(s) in the graph?
- Mark these places on a number line: use ‘$\,z\,$’ for zero and ‘$\,B\,$’ for break.
- Label the number line itself as ‘Sign of $f(x)$’.
Zeros: $\,2, -1\,$
Break: $\,1$
Step 3:
Test the resulting subintervals.
Step 4:
Report the solution set.
Solution Set of $\,f(x) \le 0\,$:
$$\cssId{s165}{(-\infty,-1]\cup (1,2]}$$
Sentence Form of Solution Set:
$$\cssId{s167}{x\le -1\ \ \text{ or }\ \ 1 \lt x \le 2}$$