 Piecewise-Defined Functions
A piecewise-defined function has different rules for different inputs.
Here is a typical piecewise-defined function:
Or, with slightly different formatting and notation:
Recall that ‘$\,x\in [-1,1)\,$’ means that $\,x\,$ is a member of the interval $\,[-1,1)\,.$
Finding Function Values for a Piecewise-Defined Function
This function $\,f\,$ uses three rules (one for each row). That is, it has three ‘pieces’ (hence the name piecewise-defined function):
- For inputs in the interval $\,[-1,1)\,,$ the linear function $\,-x+3\,$ is used for the outputs.
- For inputs in the interval $\,[1,2)\,,$ the constant function $\,5\,$ is used for the outputs.
- For inputs in the interval $\,[2,\infty)\,,$ the quadratic function $\,x^2\,$ is used for the outputs.
Here are some examples:
| Find this function value: | $f(-1)$ |
| Which interval is $\,x\,$ in? | $-1\in [-1,1)$ |
| So, use this rule ... | $-x+3\,$ (first row) |
| Solution: | $f(-1) = -(-1) + 3 = 4$ |
| Find this function value: | $f(0)$ |
| Which interval is $\,x\,$ in? | $0\in [-1,1)$ |
| So, use this rule ... | $-x+3\,$ (first row) |
| Solution: | $f(0) = -(0) + 3 = 3$ |
| Find this function value: | $f(0.9)$ |
| Which interval is $\,x\,$ in? | $0.9\in[-1,1)$ |
| So, use this rule ... | $-x+3\,$ (first row) |
| Solution: | $f(0.9) = -(0.9) + 3 = 2.1$ |
| Find this function value: | $f(1)$ |
| Which interval is $\,x\,$ in? | $1\in [1,2)\,$ |
| So, use this rule ... | $5\,$ (second row) |
| Solution: | $f(1) = 5$ |
| Find this function value: | $f(1.99999)$ |
| Which interval is $\,x\,$ in? | $1.99999 \in [1,2)$ |
| So, use this rule ... | $5\,$ (second row) |
| Solution: | $f(1.99999) = 5$ |
| Find this function value: | $f(2)$ |
| Which interval is $\,x\,$ in? | $2 \in [2,\infty)$ |
| So, use this rule ... | $x^2\,$ (third row) |
| Solution: | $f(2) = 2^2 = 4$ |
| Find this function value: | $f(\pi)$ |
| Which interval is $\,x\,$ in? | $\pi \in [2,\infty)$ |
| So, use this rule ... | $x^2\,$ (third row) |
| Solution: | $f(\pi) = \pi^2$ |
Reading a Piecewise-Defined Function Aloud
If forced to read the function $$ \cssId{s51}{ f(x) = \cases { -x + 3 &\text{if }\quad -1 \le x \lt 1\cr 5 &\text{if }\quad 1 \le x \lt 2\cr x^2 &\text{if }\quad x\ge 2 }} $$ aloud, it is typically read from left-to-right and top-to-bottom.
One possible reading could go like this:
Eff of ex equals negative ex plus three, if ex is greater than or equal to negative one and less than one;
it equals five, if ex is greater than or equal to one and less than two;
it equals ex squared, if ex is greater than or equal to two.
More often, though, people working with such a formula will just look at it and use it!
Here are additional things you should be able to do with a piecewise-defined function:
- Given a formula, find the domain
- Given a formula, produce the graph
- Given a graph, produce the formula
Finally, you should be aware of variations in notation for piecewise-defined functions.
Finding the Domain of a Piecewise-Defined Function
The domain is easy to get from the formula alone. Just ‘put together’ (union) the input sets from all the rows. Combined, these are the values of $\,x\,$ that $\,f\,$ knows how to act on.
|
top row
$[-1,1)$ |

|
|
second row
$\,[1,2)\,$ |

|
|
third row
$\,[2,\infty)\,$ |

|
|
union, to get the domain of $\,f\,$
$\text{dom}(f) = [-1,\infty)\,$ |

|
By the way, the range of $\,f\,$ is nowhere near as easy to get from the formula. Once you have a graph, though, the range is easy to obtain: just use the ‘collapse the graph into the $\,y\,$-axis’ method, as described in this earlier lesson.
Graphing a Piecewise-Defined Function
When a graph is ‘pieced together’ using different rules, as in a piecewise-defined function, you may need up to three ‘dots’ to fully understand what's happening at a place where rules are changing. This is illustrated in the sketch below:
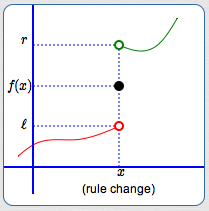
In this example, three rules are needed to fully understand what happens at and near $\,x\,$:
- There is a rule that applies at $\,x\,.$ This produces the solid (filled-in) dot, with coordinates $\,(x,f(x))\,.$ This is an actual point on the graph of the function; it is an (input,output) pair.
-
There is a rule that applies to the left of $\,x\,.$ The hollow dot at $\,\color{red}{(x,\ell)}\,$ is not a point on the graph; it is not an (input,output) pair.
When the input is $\,x\,,$ the output is not $\,\ell\,$! Instead, this hollow dot is used to show limiting behavior. It answers the question: What happens to the outputs as the inputs approach $\,x\,$ from the left-hand side? (Answer: the outputs approach the number $\,\ell\,$)
-
There is a rule that applies to the right of $\,x\,.$ The hollow dot at $\,\color{green}{(x,r)}\,$ is not a point on the graph; it is not an (input,output) pair.
When the input is $\,x\,,$ the output is not $\,r\,$! Instead, this hollow dot is used to show limiting behavior. It answers the question: What happens to the outputs as the inputs approach $\,x\,$ from the right-hand side? (Answer: the outputs approach the number $\,r\,$)
Remember: for a given value of $\,x\,,$ there can be at most one solid dot. To be a function, each allowable input must have exactly one output.
Next, we graph:
$$ \cssId{s105}{f(x) = \cases { -x + 3 &\text{if }\quad -1 \le x \lt 1\cr 5 &\text{if }\quad 1 \le x \lt 2\cr x^2 &\text{if }\quad x\ge 2 }} $$The ‘pieces’ may be graphed in any order. Here, the choice is made to move from left-to-right on the number line (from top-to-bottom in the formula).
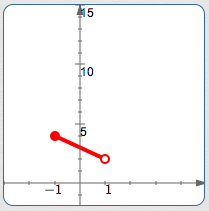
On $\color{red}{[-1,1)}$, $\,f\,$ is linear, since $\,\color{red}{-x+3}\,$ is of the form $\,mx + b\,.$
The endpoint $\,-1\,$ is included in the interval, indicated by the use of the bracket ‘$\,[\,$’ in interval notation.
The endpoint $\,1\,$ is excluded from the interval, indicated by the use of the parenthesis ‘$\,)\,$’ in interval notation.
| $x$ is ... | $-1$ |
| Included or excluded? | included |
| Substitute into $\,-x+3\,$: | $-(-1) + 3 = 1 + 3 = 4$ |
| Plot the point ... | $(-1,4)$ |
| ... using this kind of dot: | solid |
| $x$ is ... | $1$ |
| Included or excluded? | excluded |
| Substitute into $\,-x+3\,$: | $-(1) + 3 = -1 + 3 = 2$ |
| Plot the point ... | $(1,2)$ |
| ... using this kind of dot: | hollow |
Important: the point $\,(1,2)\,$ is not a point on the graph of $\,f\,.$ This hollow dot is used to show limiting behavior: as the inputs approach $\,1\,$ from the left-hand side, the outputs approach $\,2\,.$
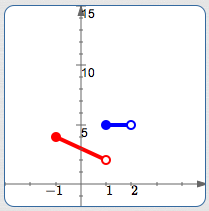
On $\,\color{blue}{[1,2)}\,,$ $\,f\,$ is constant with value $\,\color{blue}{5}\,,$ so it graphs as a horizontal segment.
| $x$ is ... | $1$ |
| Included or excluded? | included |
| Substitute into the constant function $\,5\,$: | $5$ |
| Plot the point ... | $(1,5)$ |
| ... using this kind of dot: | solid |
| $x$ is ... | $2$ |
| Included or excluded? | excluded |
| Substitute into the constant function $\,5\,$: | $5$ |
| Plot the point ... | $(2,5)$ |
| ... using this kind of dot: | hollow |
Important: the point $\,(2,5)\,$ is not a point on the graph of $\,f\,.$ This hollow dot is used to show limiting behavior: as the inputs approach $\,2\,$ from the left-hand side, the outputs approach $\,5\,.$
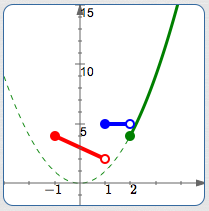
On $\,\color{green}{[2,\infty)}\,,$ $\,f\,$ is quadratic, since $\,\color{green}{x^2}\,$ is of the form $\,ax^2 + bx + c\,.$ Thus, it graphs as a piece of a parabola on this interval.
Think about what the entire graph of $\,y = x^2\,$ looks like (it is lightly dashed here), and draw in the portion for the inputs $[2,\infty)\,.$
| $x$ is ... | $2$ |
| Included or excluded? | included |
| Substitute into $\,x^2\,$: | $2^2 = 4$ |
| Plot the point ... | $(2,4)$ |
| ... using this kind of dot: | solid |
Here is the description of the piecewise-defined function $\,f\,,$ color-coded with its graph (above):
$$ \cssId{s159}{f(x) = \cases { \color{red}{-x + 3} &\text{if }\quad -1 \le x < 1\cr \color{blue}{5} &\text{if }\quad 1 \le x < 2\cr \color{green}{x^2} &\text{if }\quad x\ge 2 }} $$Getting the Formula for a Piecewise-Defined Function from its Graph
To go from a graph to a formula, you need additional information for any non-linear and non-constant sections, perhaps like this:
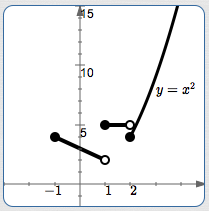
There will be three rows in the piecewise-defined function, since there are three ‘pieces’.
You may want to put the proper inputs in place first: left-to-right on the number line corresponds to top-to-bottom in the rows. Be very careful about solid dots and hollow dots!
Put any ‘easy’ formulas in place at the same time (like constant functions and labeled pieces):
$$ \cssId{s169}{f(x) = \cases { ... &\text{if }\quad -1 \le x \lt 1\cr 5 &\text{if }\quad 1 \le x \lt 2\cr x^2 &\text{if }\quad x\ge 2 }} $$It remains only to get the formula for the linear section:
- Read off the coordinates $\,(-1,4)\,$ and $\,(1,2)$
- Find the slope: $$\cssId{s173}{m = \frac{2-4}{1 - (-1)} = \frac{-2}{2} = -1}$$
- Use point-slope form with either endpoint: $$\cssId{s175}{y - 2 = -(x - 1)}$$
-
Solve for $\,y\,$:
$$\begin{align} y &= -(x-1) + 2\cr &= -x+1+2\cr &= -x+3 \end{align} $$
Put the formula $\,-x+3\,$ in the top row. Done!
Variations in Notation for Piecewise-Defined Functions
There are a variety of styles for formatting piecewise-defined functions, including (but not limited to):
- Using the word ‘for’ instead of ‘ if ’ to specify the input values
- Putting commas after each rule
- Putting commas at the very end of all rows but the last
Lots of different combinations are possible. Here are some examples:
(Commas after each rule)
(Commas at the very end of all rows but the last)
(Use the word ‘for’ instead of ‘if’)
With beautiful typesetting (including all the words ‘ if ’ lined up vertically), this author prefers the simplest formatting, with no extra punctuation.