 Graphical Interpretation of Sentences like $\,f(x)=0\,$ and $\,f(x)\gt 0$
Need some basic information on graphs of functions first? Graphs of Functions
If you know the graph of a function $\,f\,,$ then it is very easy to visualize the solution sets of sentences like $\,f(x)=0\,$ and $\,f(x)\gt 0\,.$ This section shows you how!
A key observation is that a sentence like $\,f(x) = 0\,$ or $\,f(x) \gt 0\,$ is a sentence in one variable, $\,x\,.$ To solve such a sentence, you are looking for value(s) of $\,x\,$ that make the sentence true. The function $\,f\,$ is known, and determines the graph that you'll be investigating.
Recall that the graph of a function $\,f\,$ is a picture of all its (input,output) pairs: that is, it is a picture of all points of the form $\,(x,f(x))\,.$
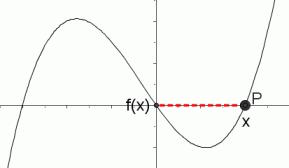
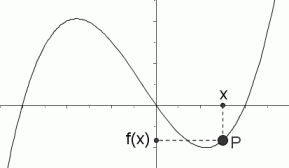
In particular, the $\,y$-value of the point $\,(x,f(x))\,$ is the number $\,f(x)\,$:
- If $\,f(x)\gt 0\,,$ then the point $\,(x,f(x))\,$ lies above the $\,x$-axis.
- If $\,f(x)=0\,,$ then the point $\,(x,f(x))\,$ lies on the $\,x$-axis.
- If $\,f(x)\lt 0\,,$ then the point $\,(x,f(x))\,$ lies below the $\,x$-axis.
These concepts are illustrated below.
The notation
$\,P(x,f(x))\,$
is a convenient shorthand for:
the point $\,P\,$ with coordinates
$\,(x,f(x))$
point $\,P(x,f(x))\,$ has $\,f(x)\gt 0\,$

point $\,P(x,f(x))\,$ has $\,f(x)=0\,$
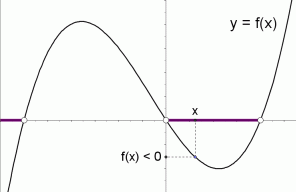
point$\, P(x,f(x))\,$ has $\,f(x)\lt 0\,$
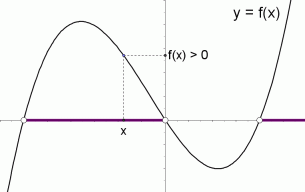
The graph of a function $\,f\,$ is shown below. The solution set of the inequality ‘$\,f(x)\gt 0\,$’ is shown in purple. It is the set of all values of $\,x\,$ for which $\,f(x)\,$ is positive. That is, it is the set of $\,x$-values that correspond to the part of the graph above the $\,x$-axis.
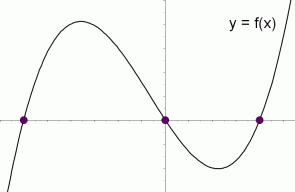
The graph of a function $\,f\,$ is shown below. The solution set of the equation ‘$\,f(x)=0\,$’ is shown in purple. It is the set of all values of $\,x\,$ for which $\,f(x)\,$ equals zero. That is, it is the set of $\,x$-intercepts of the graph.
The graph of a function $\,f\,$ is shown below. The solution set of the inequality ‘$\,f(x)\lt 0\,$’ is shown in purple. It is the set of all values of $\,x\,$ for which $\,f(x)\,$ is negative. That is, it is the set of $\,x$-values that correspond to the part of the graph below the $\,x$-axis.
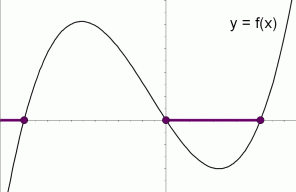
The graph of a function $\,f\,$ is shown below. The solution set of the inequality ‘$\,f(x)\ge 0\,$’ is shown in purple. It is the set of all values of $\,x\,$ for which $\,f(x)\,$ is nonnegative. That is, it is the set of $\,x$-values that correspond to the part of the graph that is either on or above the $\,x$-axis.
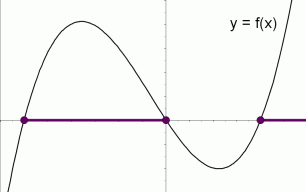
The graph of a function $\,f\,$ is shown below. The solution set of the inequality ‘$\,f(x)\le 0\,$’ is shown in purple. It is the set of all values of $\,x\,$ for which $\,f(x)\,$ is nonpositive. That is, it is the set of $\,x$-values that correspond to the part of the graph that is either on or below the $\,x$-axis.
Example
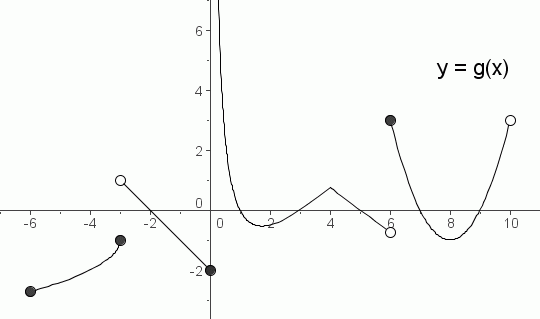
The graph of a function $\,g\,$ with domain $\,[-6,10)\,$ is shown below.
Pay attention to the difference between the brackets ‘$\,[\ ]\,$’ and parentheses ‘$\,(\ )\,$’ and braces ‘$\,\{\ \}\,$’ in the solutions sets!
The solution set of the inequality ‘$\,g(x)\gt 0\,$’ is: $$\cssId{s41}{(-3,-2)\cup (0,1)\cup (3,5)\cup [6,7)\cup (9,10)}$$
The solution set of the inequality ‘$\,g(x)\ge 0\,$’ is: $$\cssId{s43}{(-3,-2]\cup (0,1]\cup[3,5]\cup[6,7]\cup[9,10)}$$
The solution set of the equation ‘$\,g(x)=0\,$’ is: $$\cssId{s45}{\{-2,1,3,5,7,9\}}$$
The solution set of the inequality ‘$\,g(x)\lt 0\,$’ is: $$\cssId{s47}{[-6,-3]\cup (-2,0]\cup (1,3)\cup (5,6)\cup (7,9)}$$
The solution set of the inequality ‘$\,g(x)\le 0\,$’ is: $$\cssId{s49}{[-6,-3]\cup [-2,0]\cup [1,3]\cup [5,6)\cup [7,9]}$$
Let's discuss the solution set of the inequality ‘$\,g(x)\gt 0\,$’.
Imagine a vertical line passing through the graph, moving from left to right. Every time the vertical line touches a point that lies above the $\,x$-axis, then you must include that $\,x$-value in the solution set.
Be extra careful of ‘boundary’ or ‘transition’ points—places where something interesting is happening (like where the graph crosses the $\,x$-axis, or where there's a break in the graph).
For example, suppose the vertical line reaches $\,x = -3\,.$ The point (the filled-in circle) is below the $\,x$-axis, so we don't want this $\,x$-value.
But then, the graph is above until we reach $\,x = -2\,.$ When $\,x = -2\,,$ the point is on the $\,x$-axis, so we don't want this $\,x$-value, either.
This discussion gives the interval $\,(-3,-2)\,$ in the solution set.
Remember that the symbol ‘$\,\cup\,$’, the union symbol, is used to put sets together.