 Introduction to Logarithmic Functions (Part 2)
(This page is Part 2. Click here for Part 1.)
Properties that All Logarithmic Functions Share
Let $\,f(x)=\log_b\,x\,,$ where $\,b\,$ is a positive number not equal to $\,1\,,$ and $\,x\gt 0\,.$
For all (allowable) bases $\,b\,,$ logarithmic functions share the following properties:
- The domain is the set of positive numbers: $\,\text{dom}(f)=(0,\infty)$
- The range is the set of all real numbers: $\,\text{ran}(f)=\mathbb{R}\,$
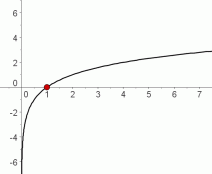
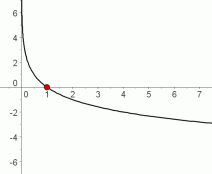
- The graph crosses the $x$-axis at $\,x = 1$
- The graph passes both the vertical and horizontal line test
The Domain is the Set of Positive Numbers: $\text{dom}(f) = (0,\infty)$
If the graph of a logarithmic function is ‘collapsed’ into the $x$-axis, sending each point on the graph to its $x$-value, then all positive $x$-values will be hit.
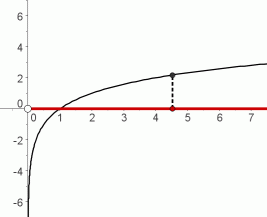
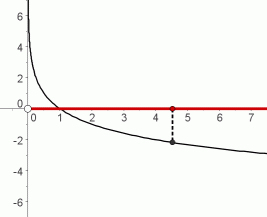
Logarithms only know how to act on positive inputs.
For basic information on the domain and range of a function, you may want to review: Domain and Range of a Function
Having trouble understanding the expression ‘$\,(0,\infty)\,$’? Then, you may want to review Interval and List Notation.
The Range is the Set of All Real Numbers: $\text{ran}(f)=\mathbb{R}$
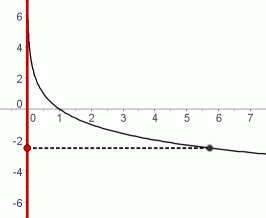
If the graph of a logarithmic function is ‘collapsed’ into the $y$-axis, sending each point on the graph to its $y$-value, then all $y$-values will be hit.
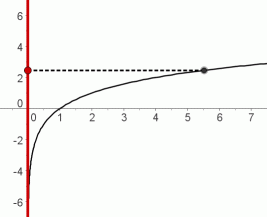
In particular, even though increasing logarithm curves rise very slowly for large inputs, they will eventually reach any desired output, no matter how big (and positive) it may be!
And, even though decreasing logarithm curves fall very slowly for large inputs, they will eventually reach any desired output, no matter how big (and negative) it may be!
Indeed, the fact that logarithmic functions increase/decrease very slowly for large inputs is an important feature of their graphs, which makes them particularly valuable in modeling slowly-changing behavior.
The Graph Crosses the $x$-axis at $\,x=1$
For allowable values of $\,b\,$:
$$ \cssId{s34}{\log_b\,1 \overset{\text{always}}{\ \ \ =\ \ \ } 0\ ,} \ \ \ \cssId{s35}{\text{ since }\ \ \ b^0 \overset{\text{always}}{\ \ \ =\ \ \ } 1} $$So, when the input is $\,1\,$ to the function $\,\log_b\,,$ the output is $\,0\,.$
Thus, the point $\,(1,0)\,$ lies on the graph of every logarithmic function.
The Graph Passes Both the Vertical and Horizontal Line Test
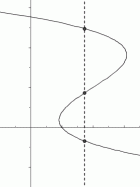
Vertical Line Test: Imagine a vertical line sweeping through a graph, checking each allowable $x$-value. If it never hits the graph at more than one point, then the graph is said to pass the vertical line test.
All functions pass the vertical line test, since the function property is that each input has exactly one output.
passes the vertical line test:
each $x$-value has only one $y$-value
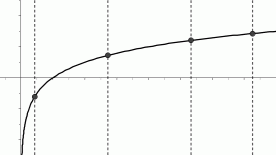
all functions
pass the vertical line test
fails the vertical line test:
there exists an $x$-value
that has more than one $y$-value
Horizontal Line Test: Imagine a horizontal line sweeping through a graph, checking each allowable $y$-value. If it never hits the graph at more than one point, then the graph is said to pass the horizontal line test. Some functions pass the horizontal line test, and some do not.
passes the horizontal line test:
each $y$-value has only one $x$-value
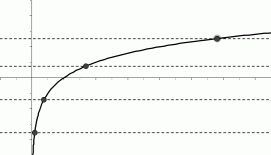
all logarithmic functions
pass the horizontal line test
fails the horizontal line test:
there exists a $y$-value
that has more than one $x$-value
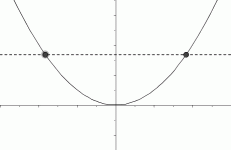
some functions
fail the horizontal line test
Thus, logarithmic functions have a wonderful property: each input has exactly one output (passes the vertical line test), and each output has exactly one input (passes the horizontal line test).
For such functions, you can think of the inputs/outputs as being connected with strings: pick up any input, and follow its ‘string’ to the unique corresponding output; pick up any output, and follow its ’string’ to the unique corresponding input. That is, there is a one-to-one correspondence between the inputs and outputs. Functions with this property are called one-to-one functions.