 Linear Inequalities in Two Variables (Part 1)
(This page is Part 1. Click here for Part 2.)
Need some basic understanding of sentences in two variables first? Introduction to Equations and Inequalities in Two Variables
Here's what this lesson offers:
- Going from Linear Equations to Linear Inequalities: The graphs change dramatically!
- Important Concepts for Graphing Linear Inequalities in Two Variables
- The Test Point Method for Graphing Linear Inequalities in Two Variables (in Part 2)
- Special Linear Inequalities in Two Variables: You only see one variable. (in Part 2)
Going from Linear Equations to Linear Inequalities
You've already learned that the graph of $\,y = x + 1\,$ is the line shown below. This line is the picture of all the points $\,(x,y)\,$ that make the equation ‘$\,y=x+1\,$’ true.
How can ‘$\,y=x+1\,$’ be true? For a given $\,x$-value, the $\,y$-value must equal $\,x + 1\,.$ For each $\,x$-value, there is exactly one corresponding $\,y$-value—whatever $\,x\,$ is, plus $\,1\,.$
The line is the picture of all the points $\,(x,x+1)\,,$ as $\,x\,$ varies over all real numbers.
The line ‘$\,y=x+1\,$’ is all points of the form:
$$ \bigl( \cssId{s16}{x\ \ ,} \cssId{s17}{\overbrace{x+1}^{\text{the $y$-value EQUALS $x+1$}}} \bigr) $$
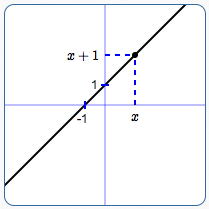 Graph of $\,y = x + 1\,$:
all points of the form $\,(x,x+1)$
Question: What happens if the verb in the sentence ‘$\,y \color{red}{=} x+1\,$’ is changed from ‘$\,\color{red}{=}\,$’ to $\,\lt\,,$ $\,\gt\,,$ $\,\le\,,$ or $\,\ge\,$?
Answer: You go from a linear equation in two variables, to a linear inequality in two variables. The solution set changes dramatically! What was a line now becomes an entire half-plane:
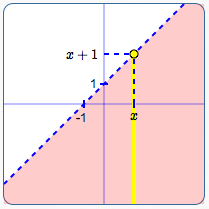 Graph of $\,y < x + 1\,$:
Line is dashed; shade below the line.
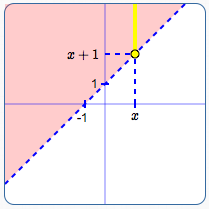 Graph of $\,y > x + 1\,$:
Line is dashed; shade above the line.
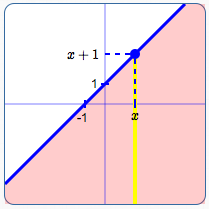 Graph of $\,y \le x + 1\,$:
Line is solid; also shade below the line.
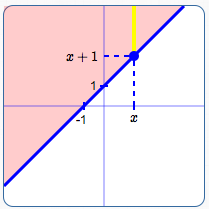 Graph of $\,y \ge x + 1\,$:
Line is solid; also shade above the line.
Important Concepts for Graphing Linear Inequalities in Two Variables
Definition: Linear Inequality in Two Variables
A linear inequality in two variables is a sentence of the form $$\cssId{s41}{ax + by + c < 0}\,,$$ where $\,a\,$ and $\,b\,$ are not both zero; $\,c\,$ can be any real number.
The inequality symbol can be any of these: $$ \cssId{s45}{\lt\,,\ \ \gt\,,\ \ \le\,,\ \ \ge} $$
Remember: ‘A sentence of the form ...’ really means ‘A sentence that can be put in the form ...’
Examples of Linear Inequalities in Two Variables:
$$ \begin{gather} \cssId{s51}{3x - 4y + 5 \gt 0}\cr \cr \cssId{s52}{y \le 5x - 1}\cr \cr \cssId{s53}{x \ge 2}\cr \cssId{s54}{\text{(shorthand for $\,x + 0y \ge 2\,$)}}\cr \cr \cssId{s55}{y \lt 5}\cr \cssId{s56}{\text{(shorthand for $\,0x + y \lt 5\,$)}} \end{gather} $$Key ideas for recognizing linear inequalities in two variables:
- The verb must be an inequality symbol: $$ \cssId{s59}{\lt\,,\ \ \le\,,\ \ \gt\,,\ \ \text{ or } \ge} $$
- The variables must be raised only to the first power: no squares, no variables in denominators, no variables under square roots, and so on.
- You don't need to have both $\,x\,$ and $\,y\,,$ but you must have at least one of these variables.
Linear Inequalities Graph as Half-Planes:
Every linear inequality in two variables graphs as a half-plane:
- If the verb is $\,\lt\,$ or $\,\gt\,,$ the boundary line is not included (dashed).
- If the verb is $\,\le\,$ or $\,\ge\,,$ the boundary line is included (solid).
Which Half-Plane to Shade?
If the linear inequality is in slope-intercept form (like $\,y \lt mx + b\,$), then it's easy to know which half of the line to shade:
- If the sentence is $\,y \lt mx + b\,$ or $\,y \le mx + b\,,$ shade below the line.
- If the sentence is $\,y \gt mx + b\,$ or $\,y \ge mx + b\,,$ shade above the line.
This only works if the inequality is in slope-intercept form! Of course, you can always put a sentence in slope-intercept form, by solving for $\,y\,.$ Then, you can use this method. But, the ‘test point method’ (in Part 2) is usually quicker-and-easier, if the sentence isn't already in slope-intercept form.